New DAC data reveals the impact of the Ukraine invasion on aid
The rise in in-donor refugee costs associated with the Ukraine invasion means less money for LDCs. The latest DAC data shows they are paying the price for challenges elsewhere.
The new data from the Development Assistance Committee (DAC) may show that aid has increased, but the crisis in Ukraine masks a reduction in levels reaching least-developed countries (LDCs) despite increasing need. Euan Ritchie sifts through the numbers and argues here that official development assistance needs to refocus towards the people it was intended to support: those living in poverty around the world who are now facing the accelerated impacts of climate change, the consequences of conflict and the hard recovery from Covid.
Ukraine conflict drives ODA to record high
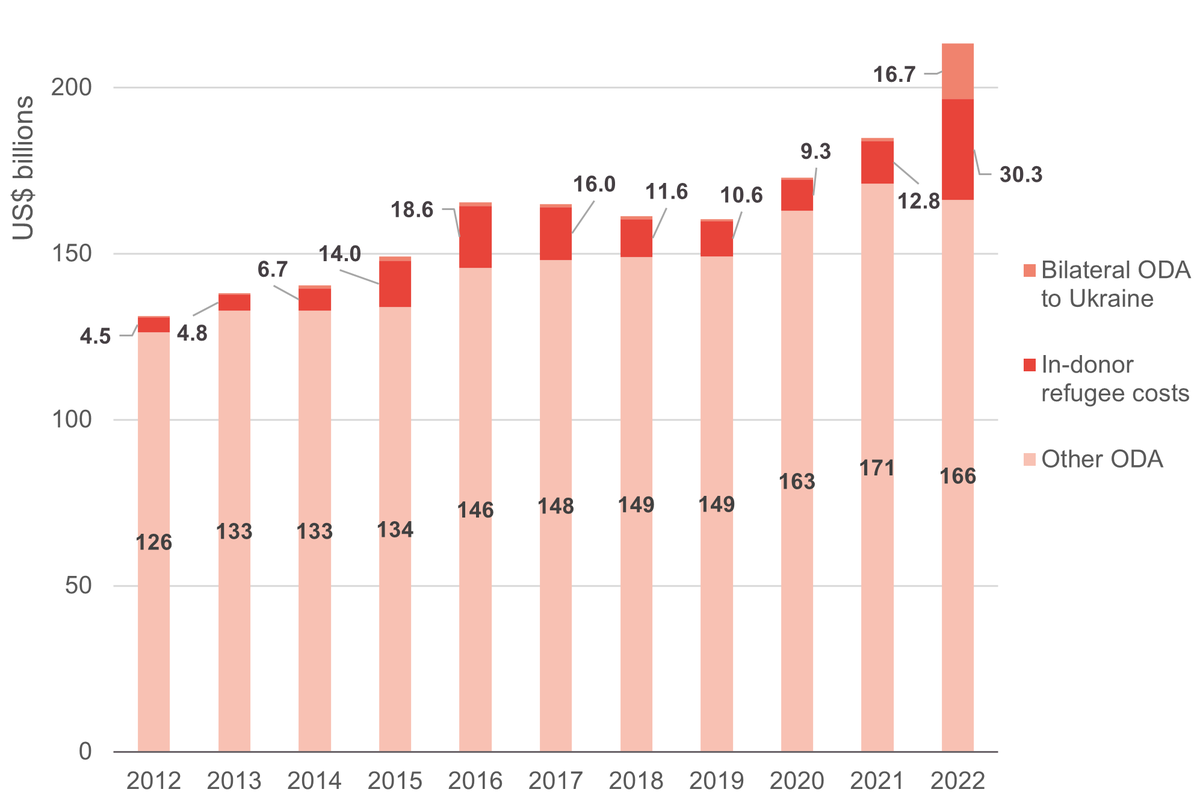
In 2022, net official development assistance (ODA) from the Development Assistance Committee (DAC) countries increased to a record high, from US$185 billion to US$213 billion – an increase of 15.3%. This increase was widely anticipated. Following Russia’s invasion of Ukraine, a large number of Ukrainians sought asylum in DAC countries, and the costs of supporting these refugees is eligible to be counted as ODA. In addition, ODA to Ukraine itself increased dramatically, from US$0.9 billion in 2021 to US$16.7 billion in 2022 (in real terms), an eighteen-fold increase.
Figure 1: Rise in in-donor refugee costs and aid for Ukraine hides fall in remaining ODA

| Year | Non-IDRC | IDRC | Aid to Ukraine |
|---|---|---|---|
| 2001 | 77 | 2 | |
| 2002 | 87 | 2 | 0.6 |
| 2003 | 91 | 3 | 0.3 |
| 2004 | 97 | 3 | 0.3 |
| 2005 | 129 | 3 | 0.3 |
| 2006 | 122 | 2 | 0.3 |
| 2007 | 112 | 2 | 0.3 |
| 2008 | 125 | 3 | 0.3 |
| 2009 | 126 | 3 | 0.4 |
| 2010 | 133 | 3.7 | 0.5 |
| 2011 | 131 | 4.4 | 0.5 |
| 2012 | 126 | 4.5 | 0.4 |
| 2013 | 133 | 4.8 | 0.3 |
| 2014 | 133 | 6.7 | 0.8 |
| 2015 | 134 | 14.0 | 1.3 |
| 2016 | 146 | 18.6 | 1.1 |
| 2017 | 148 | 16.0 | 0.8 |
| 2018 | 149 | 11.6 | 0.8 |
| 2019 | 149 | 10.6 | 0.7 |
| 2020 | 163 | 9.3 | 0.6 |
| 2021 | 171 | 12.8 | 0.9 |
| 2022 | 166 | 30.3 | 16.7 |
Source: DI analysis of OECD DAC data.Notes: Net ODA disbursements, constant 2021 prices.
When these costs are excluded, there was a slight decrease in net ODA, from US$171 billion to US$166 billion. This fall comes despite numerous crises occurring in 2022 beyond the Ukraine invasion, such as the worst drought ever recorded in Somalia, record-breaking floods in Pakistan and increasingly felt impacts of climate change. Excluding Ukraine, humanitarian need alone increased by around US$8 billion in 2022, to say nothing of the yawning gap between SDG financing and needs .
► Read more from DI about ODA (aid)
► Share your thoughts with us on Twitter or LinkedIn
► Sign up to our newsletter
Some countries showed evidence of aid diversion, others increased ODA for other priorities
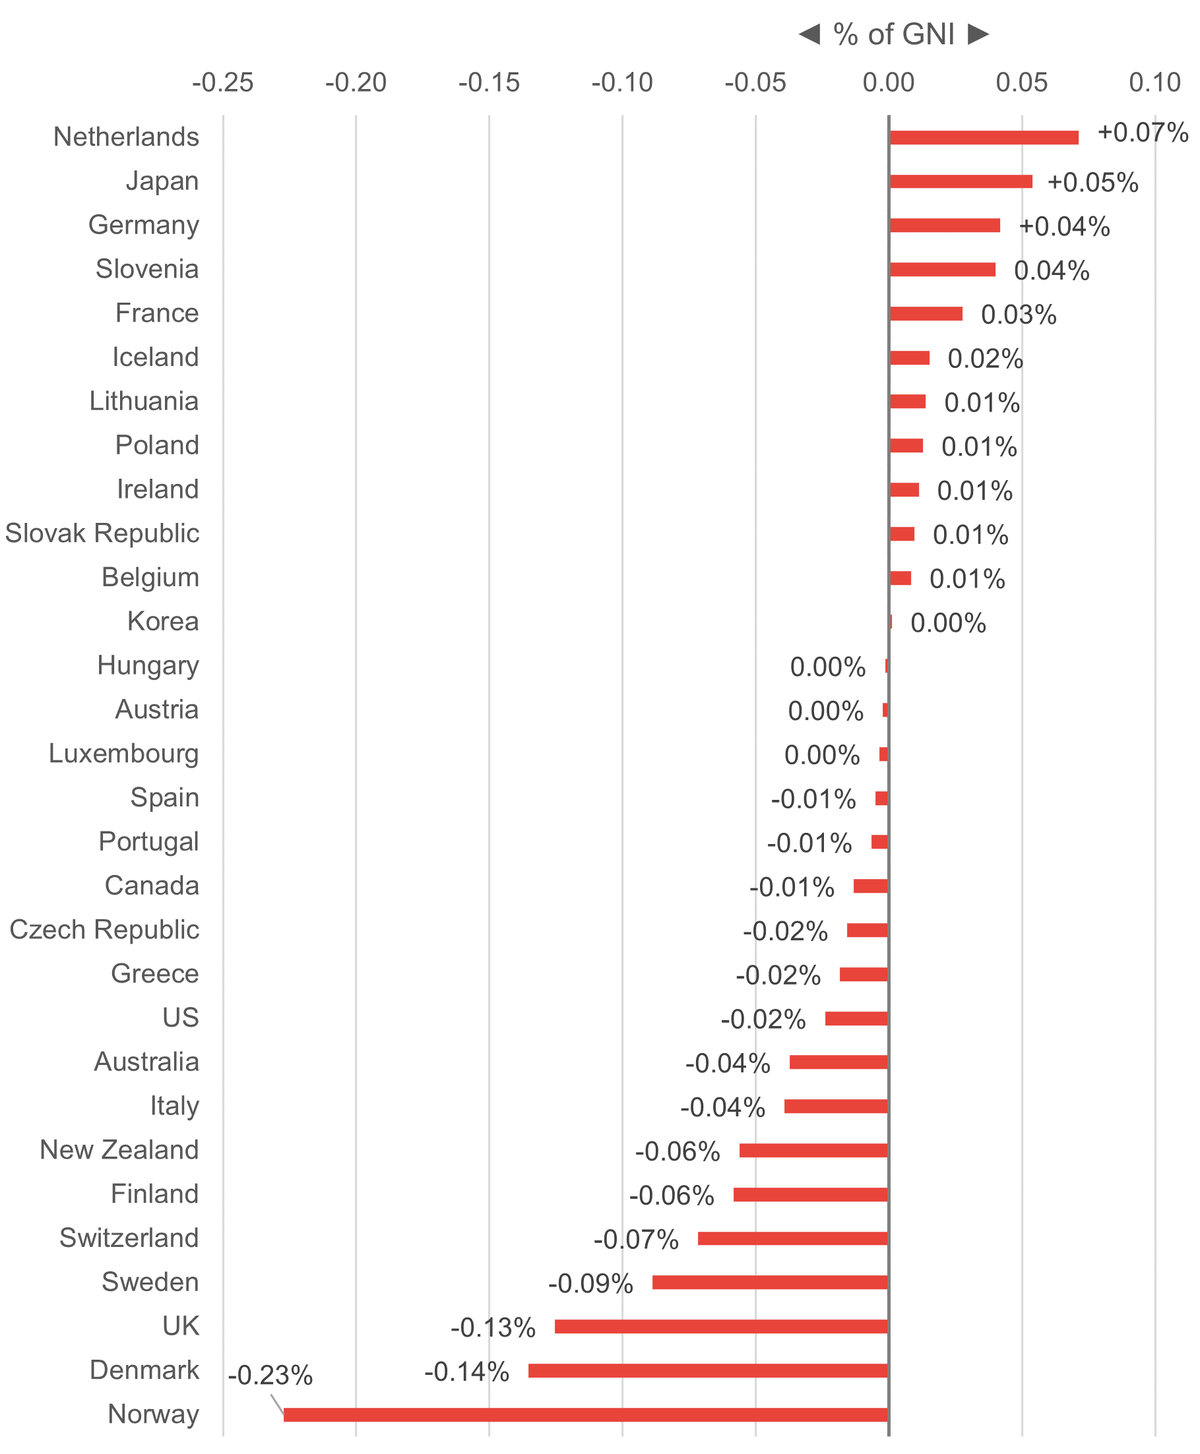
Norway, Denmark, the UK and Sweden recorded by far the largest drops in ODA relative to gross national income (GNI) in 2022 excluding aid to Ukraine and in-donor refugee costs (IDRC). This is unsurprising: as we discussed last year , these four countries were the most explicit in their intention to reduce aid elsewhere to accommodate additional spending on refugees within their countries. Each is publicly (or legally) committed to ODA/GNI targets, which in practice can end up being treated as ceilings. This means that less financial assistance reaches low- and middle-income countries, where ODA was originally intended.
Figure 2: Change in net ODA between 2021 and 2022, excluding bilateral aid to Ukraine and in-donor refugee costs

| Netherlands | 0.07 |
| Japan | 0.05 |
| Germany | 0.04 |
| Slovenia | 0.04 |
| France | 0.03 |
| Iceland | 0.02 |
| Lithuania | 0.01 |
| Poland | 0.01 |
| Ireland | 0.01 |
| Slovak Republic | 0.01 |
| Belgium | 0.01 |
| Korea | 0.00 |
| Hungary | 0.00 |
| Austria | 0.00 |
| Luxembourg | 0.00 |
| Spain | -0.01 |
| Portugal | -0.01 |
| Canada | -0.01 |
| Czech Republic | -0.02 |
| Greece | -0.02 |
| US | -0.02 |
| Australia | -0.04 |
| Italy | -0.04 |
| New Zealand | -0.06 |
| Finland | -0.06 |
| Switzerland | -0.07 |
| Sweden | -0.09 |
| UK | -0.13 |
| Denmark | -0.14 |
| Norway | -0.23 |
Source: DI analysis of OECD DAC data.
While most countries (18 out of 30) recorded a fall in net ODA excluding Ukraine and in-donor refugee costs, there were notable exceptions. The Netherlands and Germany both roughly doubled their ODA expenditure on Ukraine and in-donor refugee costs combined, but were also among the countries to record the biggest increases in other ODA relative to GNI. For Germany this echoes the previous refugee crisis: in 2016 Germany recorded the largest increase in in-donor refugee costs, but simultaneously scaled up other ODA significantly.
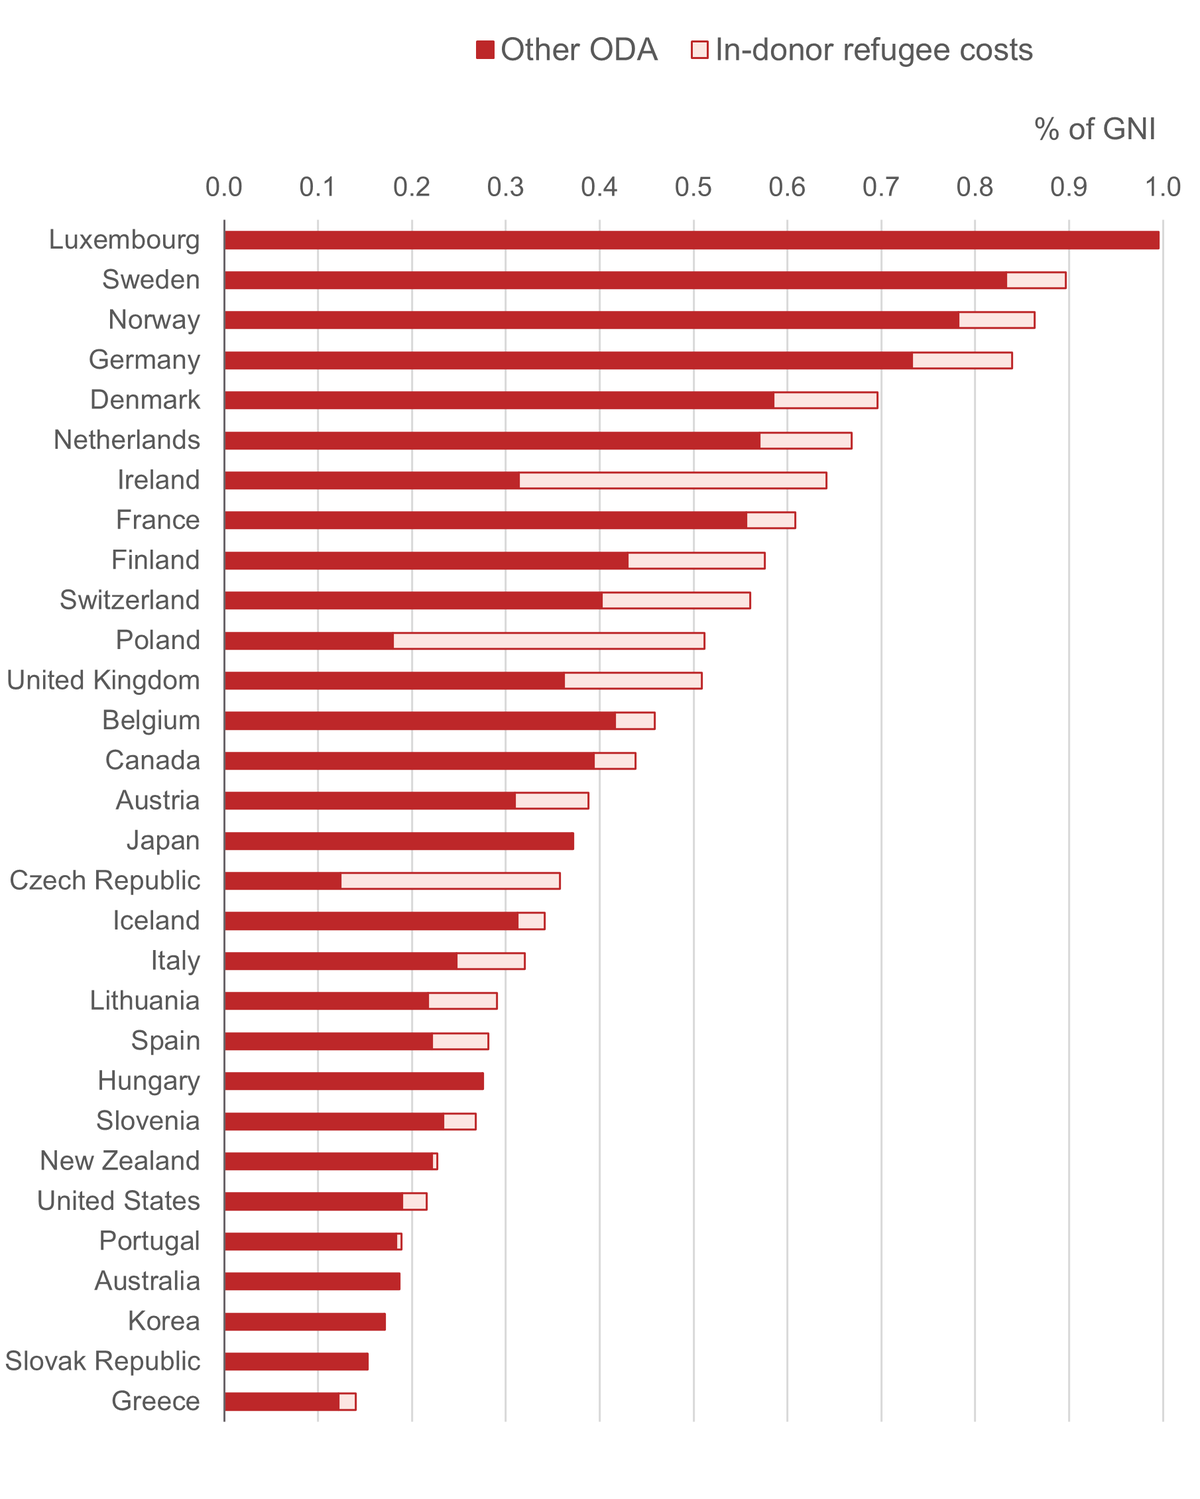
Nevertheless, while the reaction to the crisis in Ukraine has not diverted aid from other causes in all countries (see Figure 2), it has distorted the picture regarding DAC members’ generosity, given the huge shares of ODA spent on in-donor refugee costs by some countries. Poland, Czechia and Ireland each spent over half of their ODA on in-donor refugee costs in 2022; the UK, Switzerland, Finland and Lithuania each spent more than a quarter. Poland had the 11th highest ODA/GNI ratio in 2022, but when in-donor refugee costs are removed it falls to 26th while Ireland falls from seventh to 14th.
Figure 3: There is now huge variation in share of in-donor refugee costs in total ODA by donor

| Donor | Other ODA (% of GNI) | IDRC (% of GNI) |
|---|---|---|
| Luxembourg | 1.0 | 0.0 |
| Sweden | 0.8 | 0.1 |
| Norway | 0.8 | 0.1 |
| Germany | 0.7 | 0.1 |
| Denmark | 0.6 | 0.1 |
| Netherlands | 0.6 | 0.1 |
| Ireland | 0.3 | 0.3 |
| France | 0.6 | 0.1 |
| Finland | 0.4 | 0.1 |
| Switzerland | 0.4 | 0.2 |
| Poland | 0.2 | 0.3 |
| UK | 0.4 | 0.1 |
| Belgium | 0.4 | 0.0 |
| Canada | 0.4 | 0.0 |
| Austria | 0.3 | 0.1 |
| Japan | 0.4 | 0.0 |
| Czech Republic | 0.1 | 0.2 |
| Iceland | 0.3 | 0.0 |
| Italy | 0.2 | 0.1 |
| Lithuania | 0.2 | 0.1 |
| Spain | 0.2 | 0.1 |
| Hungary | 0.3 | 0.0 |
| Slovenia | 0.2 | 0.0 |
| New Zealand | 0.2 | 0.0 |
| US | 0.2 | 0.0 |
| Portugal | 0.2 | 0.0 |
| Australia | 0.2 | 0.0 |
| Korea | 0.2 | 0.0 |
| Slovak Republic | 0.2 | 0.0 |
| Greece | 0.1 | 0.0 |
Source: DI analysis of OECD DAC data.
Bilateral ODA to least developed countries (LDCs) declines
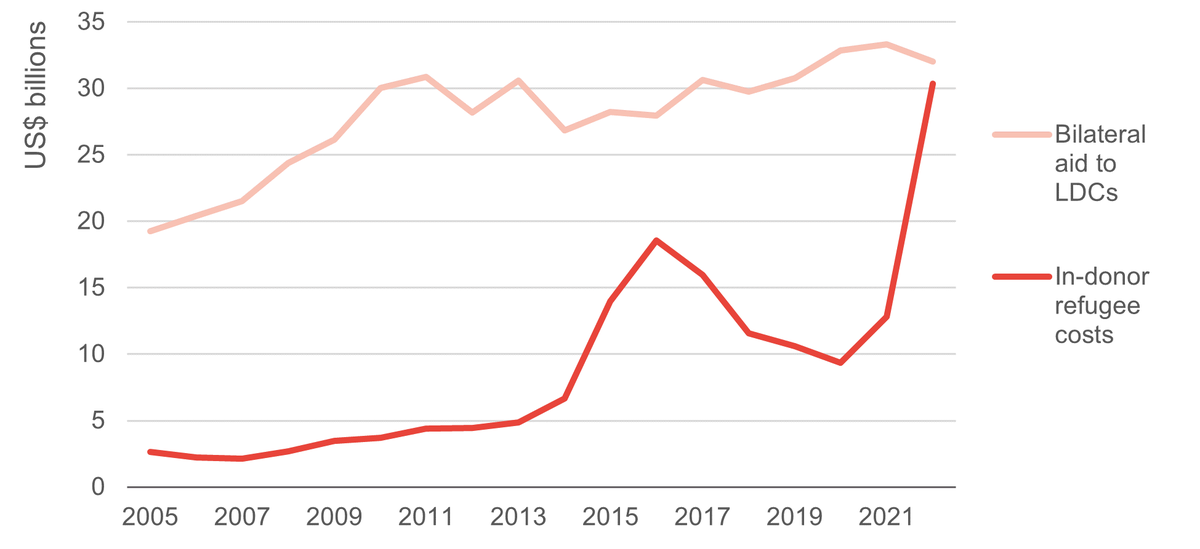
LDCs face specific challenges that make ODA particularly valuable, such as insufficient resources to fund adequate healthcare or education provision from domestic resources, and a comparative difficulty in attracting private finance. But bilateral ODA to these countries fell in 2022, from US$33 billion to US$32 billion. The dramatic rise in spending on in-donor refugee costs means that DAC countries now spend a similar amount on this as they do in LDCs. And IDRC is not the only category of ODA to be spent entirely within provider countries. Last year, ODA spent within provider countries (“ non-transfer ODA ”) excluding in-donor refugee costs was US$15 billion. If this spending remains the same in 2022, DAC countries will have spent 41% more in their own countries than in LDCs in 2022.
Figure 4: DAC donors spent nearly as much ODA on in-donor refugee costs as in LDCs

| Year | IDRC | LDCs |
|---|---|---|
| 2001 | 2.296761 | 12.14904 |
| 2002 | 1.855549 | 15.76061 |
| 2003 | 2.664221 | 22.22638 |
| 2004 | 2.845511 | 19.8267 |
| 2005 | 2.64929 | 19.26734 |
| 2006 | 2.239458 | 20.3962 |
| 2007 | 2.154624 | 21.49579 |
| 2008 | 2.669407 | 24.37749 |
| 2009 | 3.489237 | 26.14907 |
| 2010 | 3.713893 | 30.03358 |
| 2011 | 4.402396 | 30.88096 |
| 2012 | 4.453485 | 28.17408 |
| 2013 | 4.846099 | 30.56978 |
| 2014 | 6.650216 | 26.85257 |
| 2015 | 13.9876 | 28.20738 |
| 2016 | 18.55361 | 27.92784 |
| 2017 | 15.95214 | 30.61641 |
| 2018 | 11.56557 | 29.76131 |
| 2019 | 10.60091 | 30.79184 |
| 2020 | 9.348907 | 32.84093 |
| 2021 | 12.83961 | 33.32171 |
| 2022 | 30.33274 | 32 |
Source: DI analysis of OECD DAC data.
Notes: Net ODA disbursements, constant 2021 prices.
In-donor refugee costs will remain elevated in 2023
Given the timing of the arrival of Ukrainian refugees in DAC countries, in-donor refugee costs will also be significantly elevated in 2023 (costs are eligible to be counted within one year of arrival, so costs associated with refugees arriving in December will largely be counted the following year). The ONE Campaign estimated that such costs would be slightly higher in 2023, based on UNHCR data on date of refugee-arrival. In addition, remaining ODA budgets may have been less flexible in 2022 than they could be over the coming year. Many budgets may have already been allocated prior to the sudden onset of the Ukraine crisis, making it more difficult to accommodate the additional expenditure. There is therefore a risk that ODA budgets beyond Ukraine and in-donor refugee costs could be harder hit in 2023.
Debates on what should be counted as ODA set to continue
The new data shows a significant disparity between ODA figures and the amount of aid that actually reaches partner countries. This is not a new phenomenon. In 2016, in-donor refugee costs absorbed a similar amount of ODA, at 14%. Before that, in 2005 debt cancellations (mainly on export credits which were neither development nor concessional) absorbed over 20% of ODA. Nevertheless the data re-focuses the spotlight on this question, and will likely intensify debates as to what ODA should include , whether there are other metrics that do a better job of assessing the generosity of provider countries – or even whether the right people are making the decisions . ODA is supposed to measure 'donor effort', but when many countries are the biggest recipient of their own ODA programmes, it raises questions as to what 'effort' is actually being measured.
DAC countries have responded strongly to the Ukraine invasion, both by providing generous amounts of aid, and by accepting large numbers of refugees. They should be applauded for this without doubt. But the fall in the remainder of ODA, despite the huge and increasing challenges faced by low- and middle-income countries, is worrying and goes against the core mission for ODA to support those who most need it around the world. This latest data release highlights the importance of delving beneath the headline numbers to better understand global aid trends. And what it tells us is that the very countries that should be benefiting from this scarce resource are losing out – just when they need it most.
Related content
Reflections on the future of financing for development in the countries with the greatest needs
The world is not currently on track to meet the Sustainable Development Goals. In this blog, Maria Ana Jalles d’Orey and Martha Getachew Bekele explore how key takeaways from LDC5 could help inform future development financing decisions.
The DAC debates: why aid measurement matters for development
The way we measure aid affects the type and quantity provided as well as our perceptions of it. Why are the DAC's rules controversial?
The Ukraine crisis and diverted aid: What we know so far
DI analyses emerging data on humanitarian and aid funding in 2022, finding that while Ukraine has received unprecedented funding, other crises are behind previous years