Aid in 2022: Key facts about official development assistance
Our factsheet provides key analysis of global aid reported in 2022. It includes the latest DAC data on providers, recipients, sectors and climate and gender targeting.
DownloadsKey facts about ODA in 2022
- Total ODA gross disbursements from DAC donors and multilateral organisations increased 24% in 2022 to a record high of US$269 billion, from US$217 billion in 2021, this was the highest annual percentage increase since 2006. [1] However, this increase was driven almost entirely by support to Ukraine and costs associated with hosting refugees in donor countries. Discounting these, aid increased by a modest 3.1%. [2]
- Aid provided by governments rose by 27% (US$39.3 billion) in 2022 to reach US$183.3 billion. Multilateral ODA disbursements rose by 17% (US$12.8 billion) to reach US$86.1 billion. Again, with Ukraine and in-donor refugee costs excluded, bilateral and multilateral ODA rose by 2.9% and 3.4% respectively.
- Ukraine was the standout recipient in 2022, receiving US$29.2 billion – more than the next five recipients combined, and the all-time largest amount received by a country recipient in history. India and Bangladesh were the second and third largest recipients respectively.
- Health was the largest sector in 2022, and sectors related to crisis − refugees in donor countries, and humanitarian sectors − received the second and third largest amounts of ODA in 2022. Large increases in health ODA in recent years are mostly driven by Covid-19 response. Aid to refugees in donor countries more than doubled.
- Less than a quarter (24%) of ODA was disbursed to countries grouped as least developed and/or low-income in 2022 (a fall from 31% in 2021). This is due to increased support to Ukraine and refugees in donor countries driving the volume of total ODA up, while ODA to least developed countries (LDCs) saw an absolute fall in ODA volumes over 2021−2022.
- Total bilateral ODA marked as having a climate objective grew in volume terms. Bilateral climate ODA from DAC countries increased by 25% in 2022 (from US$31.2 billion in 2021 to US$39.1 billion in 2022), its highest ever volume. However, there are continuing concerns about the accuracy of climate finance figures as measured with the Rio-markers, which are known to be used inconsistently across providers. DI are currently engaging in work that attempts to better understand how providers decide which projects to count as climate.
- The amount of gender-related ODA grew in 2022, increasing 5.8% on 2021. However, almost all of this growth was driven by other sector-focused projects that donors marked as relevant for gender outcomes. ODA to projects that had gender as their principal objective increased only marginally, and has remained largely unchanged since 2019.
- Significant growth in in-donor refugee costs resulted in an increased proportion of total ODA being spent within the country that provided it (i.e. was not transferred to a recipient country). As a share of total bilateral aid and funding to multilaterals, non-transfer aid rose from 14% in 2021 to 19% in 2022.
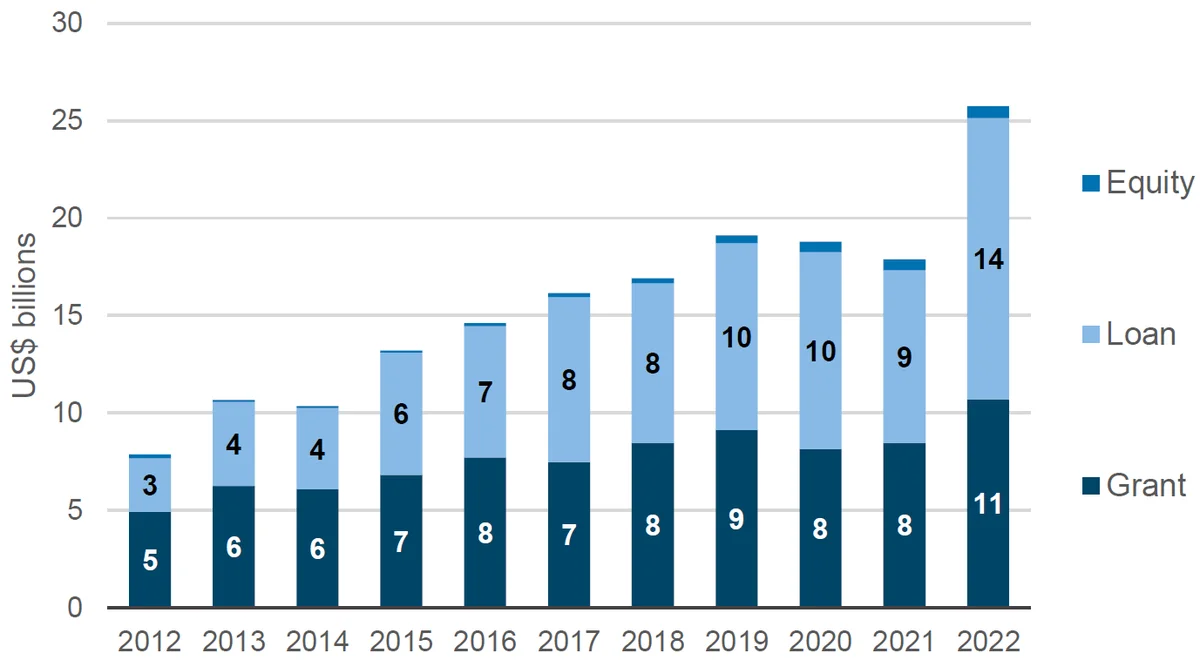
- The volume of bilateral ODA loans grew in volume terms and as a share of total ODA. Bilateral transfer loans from DAC donors increased by a third on 2021 levels, the joint highest rate of annual growth in the last decade, to reach a record US$36 billion.
Introduction
This resource highlights key facts from Development Initiatives’ analysis of global aid reported in 2022.
We use the most recently available dataset (data for calendar year 2022 published in late December 2023). [3] This factsheet includes data on aid (specifically official development assistance – ODA) reported to the Organisation for Economic Co-operation and Development’s Development Assistance Committee (OECD DAC). [4] For more about OECD DAC data, see About the data.
The dataset allows us to analyse bilateral ODA (where one government provides ODA directly to another country) and ODA disbursements from multilateral organisations (where organisations like the UN or World Bank provide ODA to countries).
The Covid-19 pandemic resulted in a significant increase in global extreme poverty. While global poverty has recovered to close to pre-pandemic levels (8.6% in 2023 compared with 9.1% in 2019), progress has been set back by three years. Furthermore, while poverty in middle-income countries has declined, the poorest countries and those affected by fragility and conflict still have higher poverty rates than before the pandemic. [5] In 2022, the majority of crises are still long-term and complex. A widespread increase in the number of people in need was driven both by existing crises worsening and major new crises, particularly in Ukraine, Afghanistan, Pakistan and Myanmar. [6] ODA plays a critical role, particularly in countries facing the biggest challenges where domestic resources are scarce and access to international markets is difficult. In this factsheet we analyse a number of ODA trends during the period 2012−2022 and unpack what the numbers tell us about where and how ODA is spent.
► Read more from DI on ODA .
► Share your thoughts with us on Twitter or LinkedIn
► Sign up to our newsletter
ODA from both governments and multilaterals increased
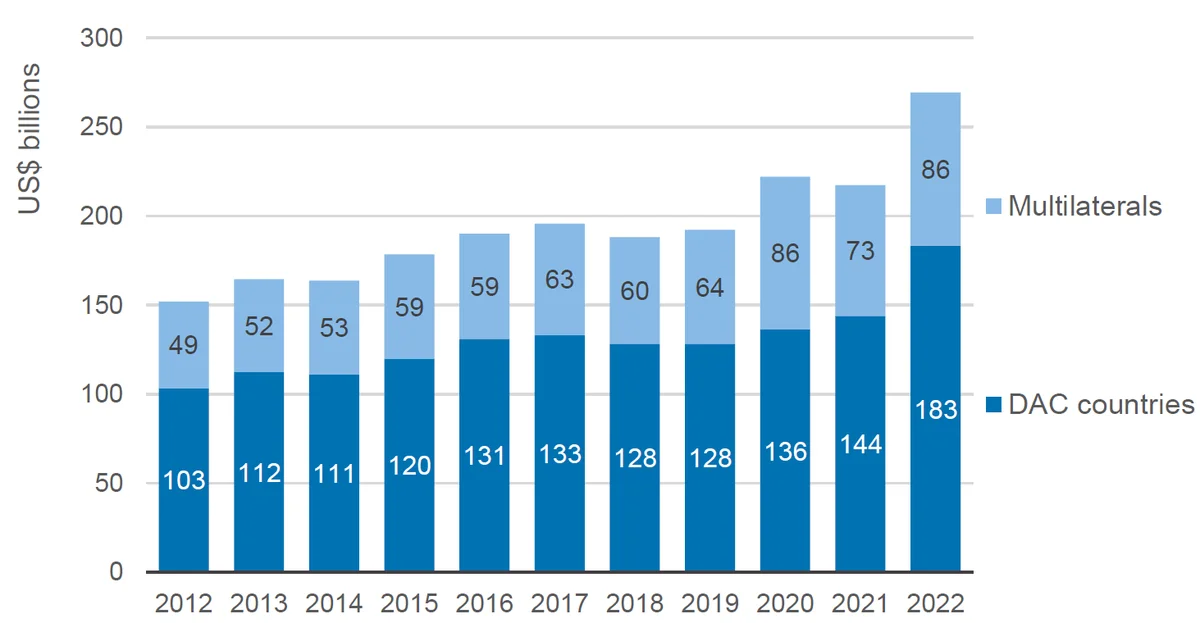
Figure 1: ODA from DAC countries and multilaterals (US$ billions)
|
Donor
type |
2012 | 2013 | 2014 | 2015 | 2016 | 2017 | 2018 | 2019 | 2020 | 2021 | 2022 |
|---|---|---|---|---|---|---|---|---|---|---|---|
| Multilaterals | 48.7 | 52.2 | 52.7 | 58.6 | 59.1 | 62.6 | 59.8 | 63.9 | 85.6 | 73.3 | 86.1 |
| DAC countries | 103.3 | 112.4 | 111.1 | 119.9 | 130.9 | 133.2 | 128.2 | 128.2 | 136.3 | 144.0 | 183.3 |
| Total | 152.0 | 164.6 | 163.8 | 178.4 | 190.1 | 195.8 | 188.0 | 192.1 | 221.9 | 217.3 | 269.4 |
Source: OECD DAC data
Notes: Gross ODA disbursements from DAC donors and multilateral organisations, constant 2021 prices.
In 2022, DAC-member governments and multilateral organisations provided a total of US$269 billion in ODA. This was US$52.1 billion higher than in 2021 (US$217 billion), – a rise of 24% and an all-time high. However, this increase was driven almost entirely by support to Ukraine (see Figure 2) and costs associated with hosting refugees in donor countries (see Figure 3). Discounting these, aid increased by a modest 3.1%.
Aid provided by governments rose by 27% (US$39.3 billion) in 2022 to reach US$183.3 billion. Multilateral ODA disbursements rose by 17% (US$12.8 billion) to reach US$86.1 billion. Again, with Ukraine and in-donor refugee costs excluded, bilateral and multilateral ODA rose by 2.9% and 3.4% respectively.
In terms of bilateral aid from DAC donors, the US, Germany, Japan, the UK, Poland, Canada, France, Ireland and Italy all recorded significant increases between 2021 and 2022:
- Bilateral aid from the US grew from US$39.0 billion to US$49.4 billion between 2021 and 2022 (a 27% increase). This is due to a significant increase in US support to Ukraine, and other increases towards sectors such as Covid-19 control, STD control including HIV/AIDS and in-donor refugee costs.
- Aid from Germany grew from US$27.7 billion to US$35 billion (a 26% increase), due to increases in in-donor refugee costs and support to Ukraine.
- Aid from Japan grew from US$17.8 billion to US$23.6 billion (a 32% increase). Japan increased aid in the form of loans to the economic and infrastructure services sector notably and recipients receiving the largest volume increases included India, Ukraine and Bangladesh.
In terms of multilateral organisations, aid increases from EU institutions and the International Development Association (IDA) were notable. Aid from the EU increased from US$24.1 billion in 2021 to US$32.8 billion in 2022 (a 36% increase). Again, this was largely due to increased support to Ukraine, a significant proportion of which was in the form of general budget support. Aid from IDA increased from US$20.8 billion in 2021 to US$24.4 billion in 2022 (an 18% increase).
Ukraine was the standout recipient of aid in 2022
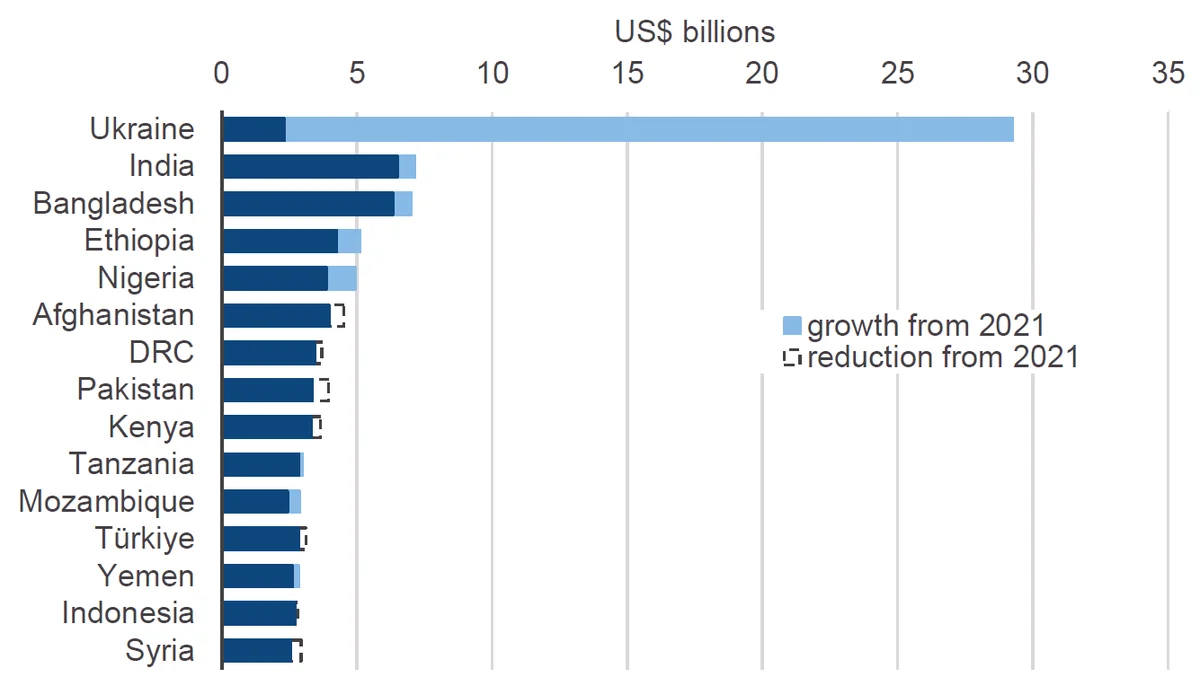
Figure 2: Top 15 recipients of ODA, 2022
| Recipient | ODA in 2021 | ODA in 2022 |
2022 greater
than 2021? |
lower value | growth from 2021 |
reduction from
2021 |
|---|---|---|---|---|---|---|
| Ukraine | 2314 | 29250 | 1 | 2314 | 29250 | |
| India | 6486 | 7125 | 1 | 6486 | 7125 | |
| Bangladesh | 6319 | 7004 | 1 | 6319 | 7004 | |
| Ethiopia | 4231 | 5096 | 1 | 4231 | 5096 | |
| Nigeria | 3867 | 4956 | 1 | 3867 | 4956 | |
| Afghanistan | 4515 | 3957 | 0 | 3957 | 4515 | |
| DRC | 3696 | 3437 | 0 | 3437 | 3696 | |
| Pakistan | 3953 | 3332 | 0 | 3332 | 3953 | |
| Kenya | 3652 | 3301 | 0 | 3301 | 3652 | |
| Tanzania | 2836 | 2994 | 1 | 2836 | 2994 | |
| Mozambique | 2430 | 2869 | 1 | 2430 | 2869 | |
| Türkiye | 3110 | 2844 | 0 | 2844 | 3110 | |
| Yemen | 2610 | 2834 | 1 | 2610 | 2834 | |
| Indonesia | 2793 | 2718 | 0 | 2718 | 2793 | |
| Syria | 2931 | 2552 | 0 | 2552 | 2931 | |
| 639 | ||||||
| 685 |
Source: OECD DAC data
Notes: Gross ODA disbursements from DAC donors and multilateral organisations, constant 2021 prices. For an expanded list, see Appendix 1. DRC = Democratic Republic of the Congo.
In 2022, Ukraine received US$29.2 billion in aid from DAC-member governments and multilateral bodies – the largest total of any country, and an increase on 2021 of US$26.9 billion (more than a 12-fold increase). This was in the form of development assistance and humanitarian assistance in response to the ongoing war in Ukraine. The amount received by Ukraine was more than the next five recipients combined, and the all-time largest amount received by a country recipient in history.
India, 2021’s largest recipient, received the second-largest total (US$7.1 billion), and Bangladesh received the third largest (US$7.0 billion). ODA to both India and Bangladesh increased over 2021−2022, by US$638.8 million and US$684.8 million respectively.
The fourth and fifth largest 2022 recipients were Ethiopia (US$5.1 billion) and Nigeria (US$5.0 billion), which both received increases on 2021 levels.
Afghanistan, DRC, Pakistan and Kenya − representing the sixth to ninth largest 2022 recipients respectively − all recorded decreases between 2021 and 2022. Tanzania, meanwhile, the 10th largest 2022 recipient, recorded an increase.
Health, refugees in donor countries and humanitarian sectors received the most aid in 2022
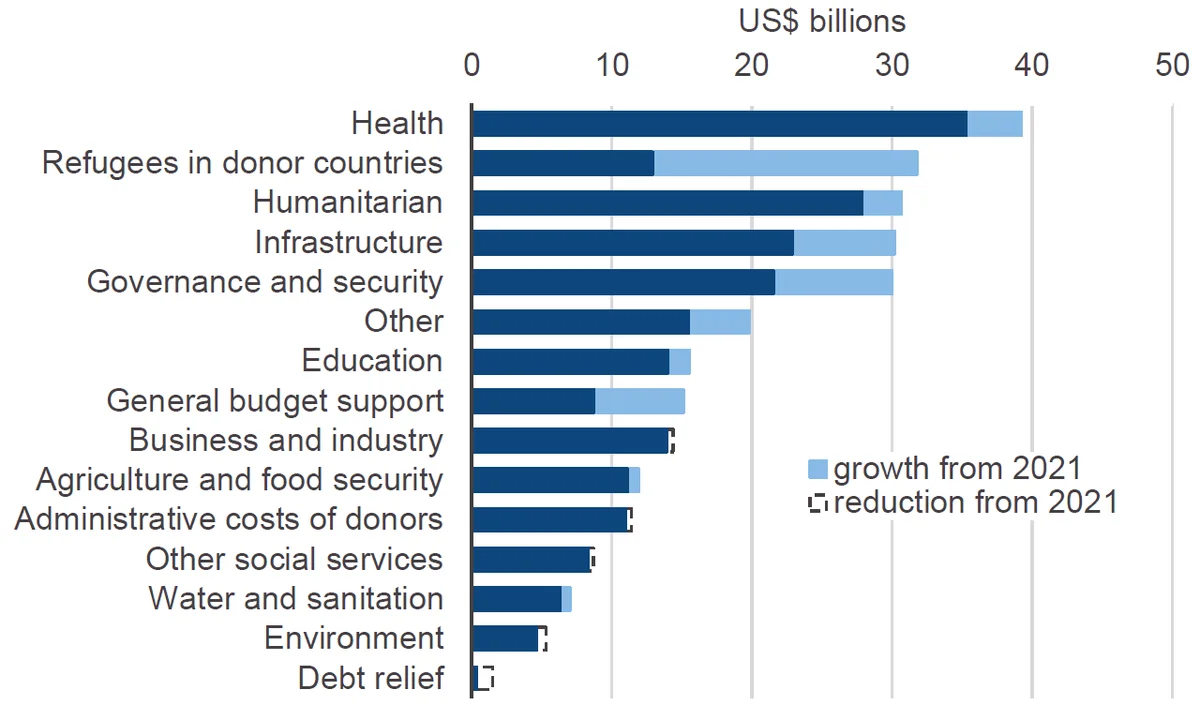
Figure 3: Sectors receiving the most ODA, 2022
|
ITEP
sector |
ODA in 2021 | ODA in 2022 |
2022 greater
than 2021? |
lower value | growth from 2021 |
reduction from
2021 |
|
|---|---|---|---|---|---|---|---|
| Health | 35289 | 39239 | 1 | 35289 | 39239 | ||
|
Refugees in
donor countries |
12883 | 31762 | 1 | 12883 | 31762 | ||
| Humanitarian | 27835 | 30634 | 1 | 27835 | 30634 | ||
| Infrastructure | 22923 | 30170 | 1 | 22923 | 30170 | ||
|
Governance and
security |
21525 | 30016 | 1 | 21525 | 30016 | ||
| Other | 15458 | 19792 | 1 | 15458 | 19792 | ||
| Education | 13991 | 15527 | 1 | 13991 | 15527 | ||
|
General budget
support |
8711 | 15110 | 1 | 8711 | 15110 | ||
|
Business and
industry |
14372 | 13930 | 0 | 13930 | 14372 | ||
|
Agriculture
and food security |
11101 | 11917 | 1 | 11101 | 11917 | ||
|
Administrative
costs of donors |
11417 | 10972 | 0 | 10972 | 11417 | ||
|
Other social
services |
8664 | 8317 | 0 | 8317 | 8664 | ||
|
Water and
sanitation |
6330 | 7007 | 1 | 6330 | 7007 | ||
| Environment | 5313 | 4615 | 0 | 4615 | 5313 | ||
| Debt relief | 1507 | 375 | 0 | 375 | 1507 |
Source: OECD DAC data
Notes: Gross ODA disbursements from DAC donors and multilateral organisations, constant 2021 prices. See Appendix 2 for more detail. The 'Other' sector includes multisector, commodities and unspecified aid.
In 2022, the sectors that received the greatest share of ODA from governments and multilateral bodies were health (US$39.2 billion), refugees in donor countries (US$31.8 billion), humanitarian (US$30.6 billion), infrastructure (US$30.2 billion), and governance, civil society and security (US$30.0 billion). Each of these top five sectors saw increases between 2021 and 2022, with aid to refugees in donor countries more than doubling.
The sector that experienced the greatest increase in volume in 2022 is refugees in donor countries, which increased by almost 150% (US$18.9 billion), its highest ever amount. This increase is attributed to the costs in accommodating the high number of Ukrainian and Afghan people displaced by conflict in 2022.
Refugees in donor countries and the humanitarian sector are both related to current crises, while large increases in health ODA in recent years are mostly driven by Covid-19 response. For example, aid to the Covid-19 control purpose code stood at US$8.5 billion in 2022 (down 7.8% on 2021), making-up over a fifth of health ODA in 2022.
In 2022, ‘general budget support’ received 5.6% of ODA – a relatively high proportion – due in part to support to Ukraine from EU institutions (US$8.9 billion). This share of general budget support ODA to total ODA had peaked in 2020 at 7.2% due to the IMF’s programme of budget support lending in response to the economic impact of Covid-19. In 2021, general budget support decreased to 4.0%, due to the tailing off of IMF’s programme.
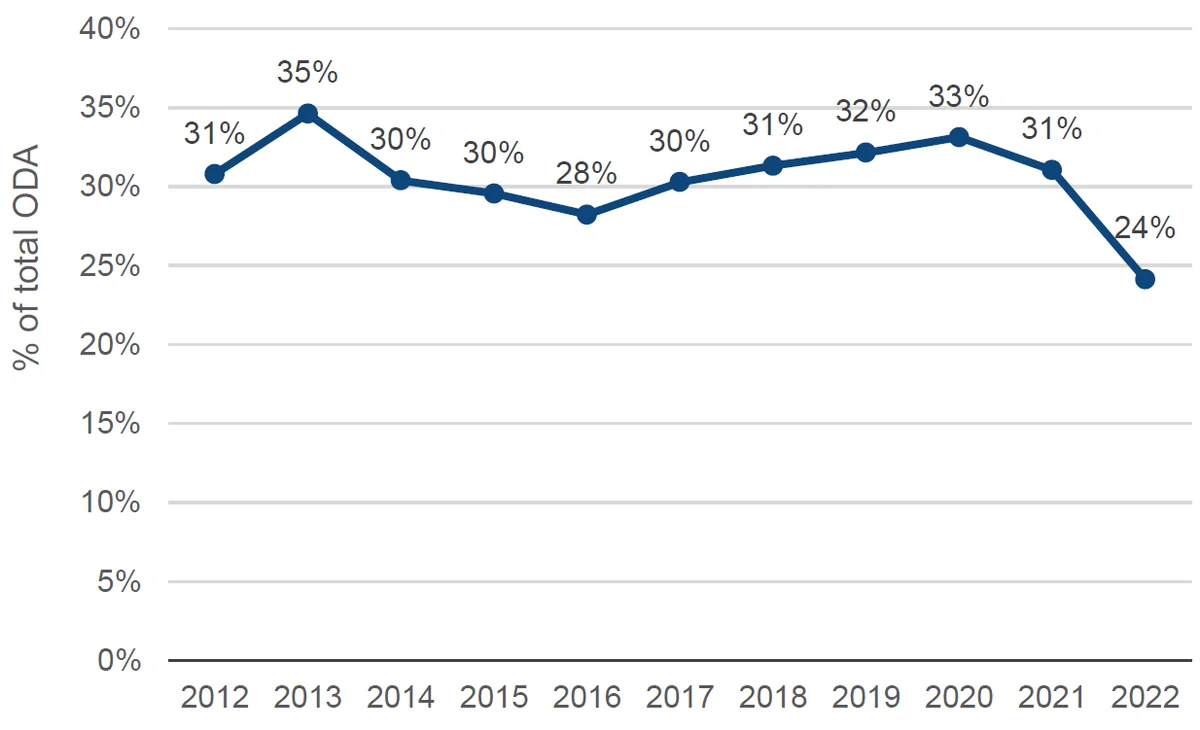
Less than a quarter of aid was disbursed to countries grouped as least developed and/or low-income
Figure 4: ODA disbursements to countries grouped as least developed and/or low income (%)
| 2012 | 2013 | 2014 | 2015 | 2016 | 2017 | 2018 | 2019 | 2020 | 2021 | 2022 | |
|---|---|---|---|---|---|---|---|---|---|---|---|
|
ODA to LDCs %
of total |
31% | 35% | 30% | 30% | 28% | 30% | 31% | 32% | 33% | 31% | 24% |
Source: OECD DAC data
Notes: Gross disbursements from DAC donors and multilateral organisations, constant 2021 prices. This chart shows the total proportion of ODA disbursed to countries grouped as least developed countries (LDCs; designated by the UN) and/or low-income (LICs; assessed by the World Bank).
ODA to low-income countries and least developed countries
The share of ODA disbursements to countries facing the greatest challenges fell from 31% in 2021 to 24% in 2022. This grouping includes low-income countries (LICs; assessed by the World Bank to have the lowest income per person). [7] It also includes the least developed countries, (LDCs; designated by the UN as those “facing severe structural impediments to sustainable development […] highly vulnerable to economic and environmental shocks and have low levels of human assets”). [8]
The fall in the share of aid to the LDC/LIC grouping is due to the increase in support in aid to Ukraine (which is outside of this grouping), and aid not specified to recipient countries (including refugees in donor countries). The volume of aid to the LDC/LIC grouping also declined from US$67.5 billion in 2021 to US$65.0 billion in 2022 (a 3.6% decrease).
ODA from DAC governments to LDCs as a share of total ODA fell from 25% to 19% between 2021 and 2022. ODA provided by multilateral donors to LDCs as a share of total ODA fell from 42% to 35%. The 2022 shares for both donor types represented the lowest share over 2012–2022, and both donor types had a volume decrease.
ODA to other income groups, and ODA not allocated by country
Technically, ODA can be allocated to low-income countries, lower-middle income countries and upper-middle income countries (as defined by the World Bank). [9]
In 2022, lower-middle income countries recorded an increase in gross ODA disbursements from DAC countries and multilaterals (with Ukraine in this grouping). Meanwhile, aid to upper middle-income countries fell. There was a US$26.3 billion increase in aid that was not allocated by country, and therefore could not be assigned an income group. Gross disbursements in this category have been increasing for over a decade and now account for 35% of disbursements (up from 32% in 2021 and 26% in 2012).
The increase in country unallocated ODA in 2022 was largely a result of the increase in in-donor refugee costs, while aid to Covid-19 control, STD control including HIV/AIDS, humanitarian assistance and multi-sector aid also reported notable increases in country unallocated aid in 2022.
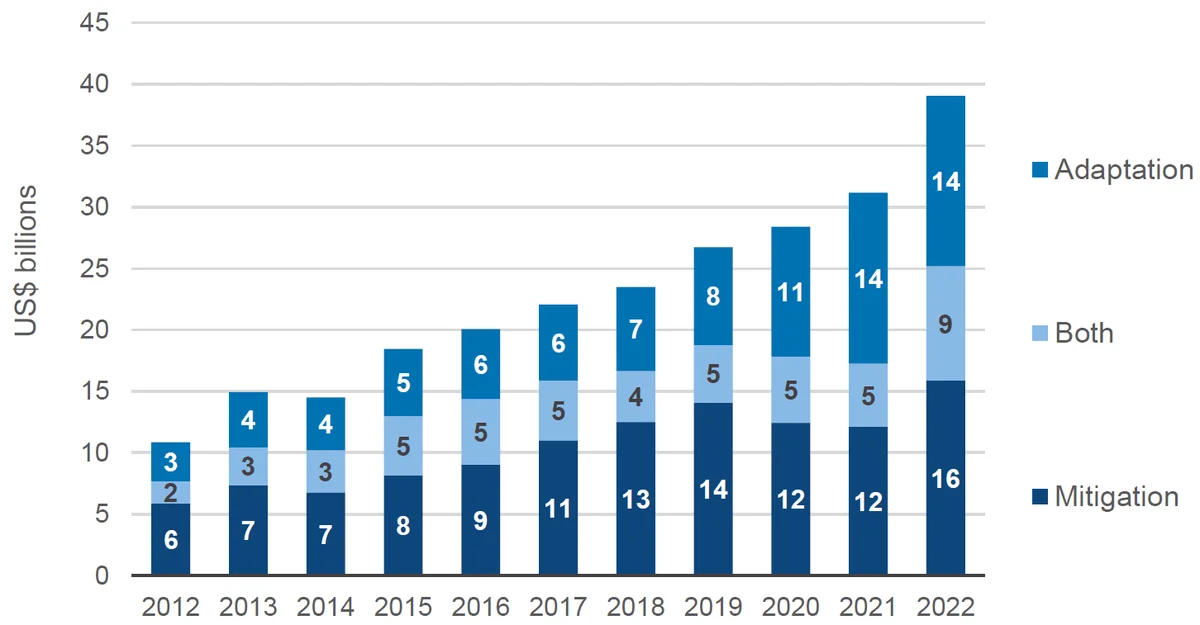
Total bilateral ODA marked as having a climate objective reached its highest ever amount in 2022
Figure 5: ODA disbursements by climate focus from DAC countries (US$ billions)
| 2012 | 2013 | 2014 | 2015 | 2016 | 2017 | 2018 | 2019 | 2020 | 2021 | 2022 | |
|---|---|---|---|---|---|---|---|---|---|---|---|
| Mitigation | 6 | 7 | 7 | 8 | 9 | 11 | 13 | 14 | 12 | 11 | 16 |
| Both | 2 | 3 | 3 | 5 | 5 | 5 | 4 | 5 | 5 | 5 | 9 |
| Adaptation | 3 | 4 | 4 | 5 | 6 | 6 | 7 | 8 | 11 | 13 | 14 |
Source: OECD DAC data
Notes: Gross ODA disbursements from DAC donors, constant 2021 prices. Activities can have the following Rio marker scores: 2 (marked as a principal climate objective); 1 (significant climate objective); and 0 (no climate objective). ODA disbursements which are marked with the same Rio marker score for both climate adaptation and mitigation markers are classified as ‘both’, while disbursements which have a greater Rio marker score in one climate focus area are marked towards the focus of the marker returning the greater score.
The amount of bilateral ODA tagged with a climate objective increased by 25%, from US$31.2 billion in 2021 to US$39.1 billion in 2022. At $7.9 billion this was the largest increase in volume over the past 10 years. Despite this increase, climate-tagged bilateral ODA took up a slightly lower share of total bilateral ODA than the year before, decreasing from 22% in 2021 to 21% in 2022.
Adaptation and mitigation
We can track climate ODA using the Rio markers, which indicate whether flows are targeted at either adaptation, mitigation, or both. In 2022, bilateral ODA marked principally as mitigation accounted for 41% of all climate-tagged bilateral ODA, a slight increase over its 2021 share of 39%. In addition, ODA tagged principally as adaptation only as a share of all climate-tagged bilateral ODA fell from 45% in 2021 to 36% in 2022. This was counterbalanced by an increase in the proportion of climate flows tagged as both adaptation and mitigation equally, rising from 16% in 2021 to 24% in 2022.
Aid for climate adaptation aims to reduce vulnerability to the current and expected impacts of climate change by maintaining or increasing resilience.
Aid for climate mitigation aims to reduce climate change by stabilising greenhouse gas concentrations in the atmosphere, promoting efforts to reduce or limit emissions and/or enhancing the capture and storage of emissions.
The increase in the overall volume of climate ODA in 2022 was driven by growth in ODA targeted principally at climate mitigation (from US$12.1 billion in 2021 to US$15.9 billion), and flows marked as both adaptation and mitigation equally (from US$5.1 billion in 2021 to US$9.3 billion). The rise in mitigation-marked ODA is attributed to an increase in bilateral ODA loans directed towards the marker, increasing from US$8.9 billion in 2021 to US$14.4 billion in 2022.
Figure 6: Mitigation-marked bilateral ODA by flow type, 2021 (US$ billions)
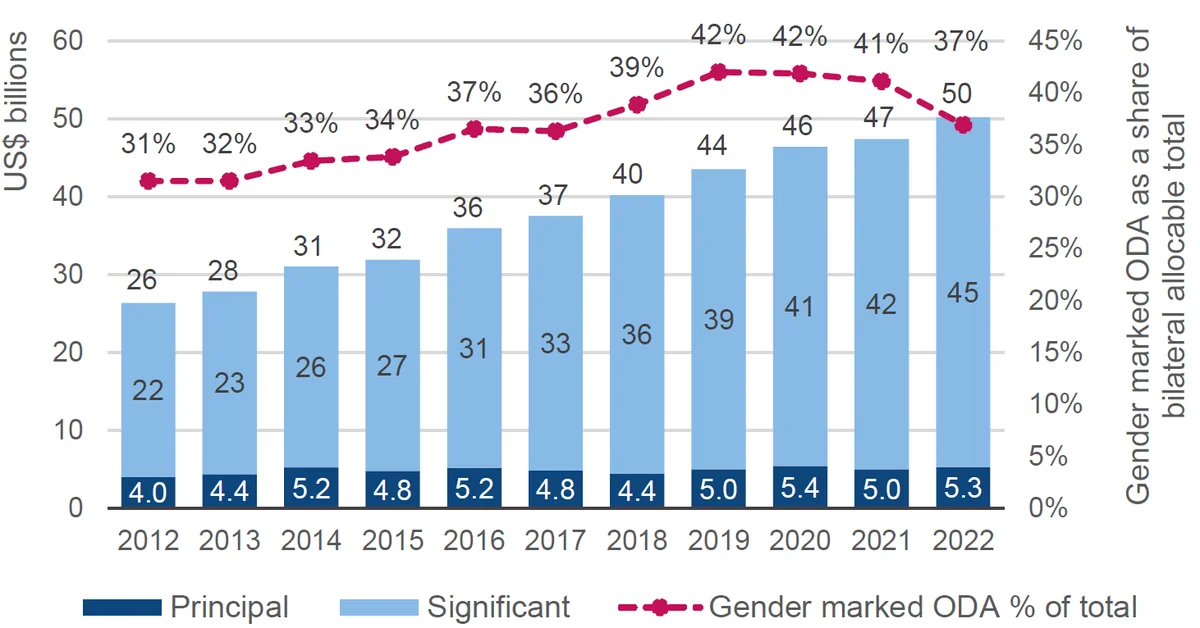
The amount of gender-related ODA reached an all-time high in 2022 but its share of total ODA fell from the previous year
Figure 7: Gender-related ODA disbursements, DAC countries (US$ billions)
|
Marker
category |
2012 | 2013 | 2014 | 2015 | 2016 | 2017 | 2018 | 2019 | 2020 | 2021 | 2022 |
|---|---|---|---|---|---|---|---|---|---|---|---|
| Not targeted | 46904 | 52795 | 56617 | 57233 | 58120 | 62169 | 60405 | 56896 | 61236 | 64622 | 75681 |
| Significant | 22350 | 23423 | 25815 | 27114 | 30746 | 32683 | 35756 | 38543 | 40990 | 42418 | 44903 |
| Principal | 3961 | 4370 | 5202 | 4778 | 5184 | 4816 | 4422 | 4968 | 5411 | 4993 | 5265 |
| Not screened | 10334 | 7600 | 5076 | 5141 | 4367 | 3574 | 2837 | 3202 | 3196 | 3287 | 10026 |
| Total | 83550 | 88188 | 92709 | 94267 | 98416 | 103242 | 103420 | 103609 | 110834 | 115320 | 135875 |
| 47.4 | 50.2 | ||||||||||
| Gender Marked total | 26312 | 27793 | 31016 | 31892 | 35930 | 37498 | 40179 | 43511 | 46401 | 47411 | 50168 |
| Gender marked ODA % of total | 31.5% | 31.5% | 33.5% | 33.8% | 36.5% | 36.3% | 38.8% | 42.0% | 41.9% | 41.1% | 36.9% |
Source: OECD DAC data
Notes: Gross ODA disbursements from DAC donors, constant 2021 prices. Aid here is bilateral allocable as recommended for analysis on the gender marker in the Gender Equality Policy Marker Handbook, available at: https://www.oecd.org/dac/gender-development/dac-gender-equality-marker.htm.
DAC-member governments increased the amount of bilateral allocable ODA specified as having a gender objective (significant or principal) from US$47.4 billion in 2021 to US$50.2 billion in 2022. This is an increase of 5.8% and represents an all-time high. However, almost all of this growth was driven by other sector-focused projects that donors marked as relevant for gender outcomes. ODA to projects that had gender as their principal objective increased only marginally (from US$5.0 billion in 2021 to US$5.3 billion in 2022), and has remained largely unchanged since 2019.
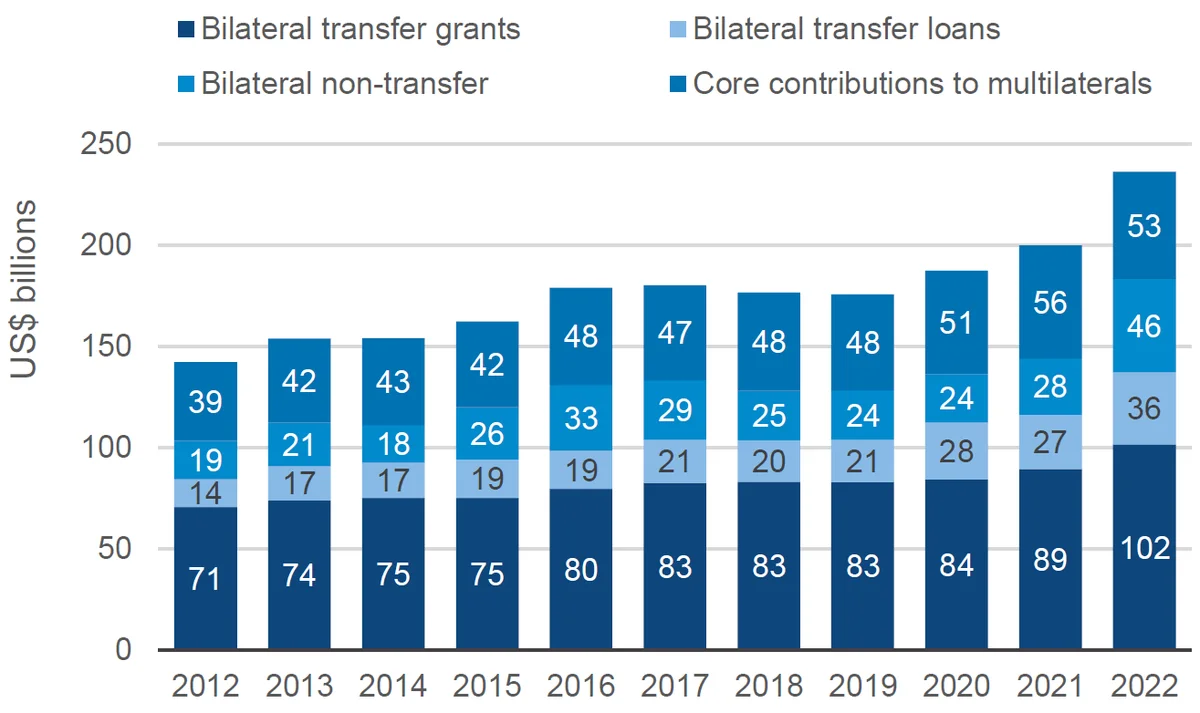
An increased proportion of bilateral ODA was spent within the country that provided it
Figure 8: DAC ODA, US$ billions: bilateral (transfer) grants, bilateral (transfer) loans, bilateral non-transfer and core contributions to multilaterals
| Type | 2012 | 2013 | 2014 | 2015 | 2016 | 2017 | 2018 | 2019 | 2020 | 2021 | 2022 |
|---|---|---|---|---|---|---|---|---|---|---|---|
| Bilateral transfer loans | 13550 | 17014 | 17486 | 19059 | 18791 | 21341 | 20467 | 20884 | 27973 | 26858 | 35738 |
| Bilateral transfer grants | 70699 | 73940 | 75205 | 75147 | 79585 | 82560 | 83114 | 82924 | 84357 | 89366 | 101524 |
| Bilateral non-transfer | 19041 | 21414 | 18407 | 25669 | 32548 | 29296 | 24604 | 24424 | 24018 | 27765 | 46040 |
|
Core contributions to
multilaterals |
38859 | 41628 | 42925 | 42430 | 48129 | 47082 | 48451 | 47645 | 51204 | 55882 | 53030 |
Source: OECD DAC data
Notes: Gross ODA disbursements from DAC donors, constant 2021 prices. Previous charts referred to ODA disbursements from multilateral organisations. By contrast, this chart includes multilateral ODA which refers to core contributions from donor countries to multilateral organisations. Hence, by definition, multilateral ODA is also ‘transfer’ ODA. See the Box for definition on non-transfer ODA.
The proportion of total ODA spent domestically (also known as ‘non-transfer aid’) increased from 14% to 19% between 2021 and 2022. This increase was driven by the rise in donor refugee hosting costs from a number of donors, including the UK, US, Germany, Poland, Ireland, Italy, Switzerland and Spain and 20 others.
The share of ODA in the form of bilateral transfer loans grew by a third between 2021 and 2022 to reach US$36 billion. This is the joint highest rate of annual growth in the last decade with 2020. As a share of total ODA from DAC donors, it increased from 13% to 15%, representing a period high. The share of bilateral transfer grants fell slightly (45% to 43%) despite increasing in volume. The share of core contributions to multilaterals fell more notably (from 28% to 22%) with this category also receiving a fall in volume.
Box
What does non-transfer aid include?
Non-transfer aid includes refugees in donor countries, imputed student costs, in-donor scholarships, administrative costs and the promotion of development awareness. It also includes debt relief, whereby governments and organisations who provide aid are allowed to include debts that are rescheduled or forgiven as ODA. The amount that can be reported as aid is capped to the nominal value of the original loan. [10]
About the data in this paper
About OECD DAC data
DAC members, which include all the main bilateral donor countries plus agencies of the EU, are obligated to report ODA data to these databases. In addition, all the main multilateral organisations voluntarily report their ODA commitments and disbursements. ODA data reported to the DAC is governed by a comprehensive set of reporting directives which means the data is standardised and comparable across different donors. Some countries which are not DAC members also report to the DAC, but many do not, (including large providers such as China and Brazil). For this reason, the following analysis is limited to DAC members and multilateral organisations.
You can find more information on the OECD DAC’s creditor reporting system database , and see the full data for download . Additional data might be included in future updates.
Our analysis
We use constant prices. This means our analysis shows the changes in ODA without the impacts of inflation.
We use gross disbursements, rather than grant equivalent. The difference between gross disbursements and the grant-equivalent measure is how ODA loans are accounted for. Gross disbursements means the full face value of the loan is reported, whereas the grant equivalent measure means only a percentage of the loan is counted as ODA. This percentage depends on how concessional the loan is – the softer the loan, the higher the percentage counted as ODA. Gross disbursements are used in this analysis as that is more reflecting of the amount of money actually transferred in the year concerned.
Appendix 1
Table A1: Largest ODA recipients by volume in 2022, with change from 2021
| Country | Rank 2022 |
Rank
2021 |
2022
(US$ millions) |
2021
(US$ millions) |
Change
2021−22 (US$ millions) |
|---|---|---|---|---|---|
| Ukraine | 1 | 21 | 29,250 | 2,314 | 26,936 |
| India | 2 | 1 | 7,125 | 6,486 | 639 |
| Bangladesh | 3 | 2 | 7,004 | 6,319 | 685 |
| Ethiopia | 4 | 5 | 5,096 | 4,231 | 864 |
| Nigeria | 5 | 7 | 4,956 | 3,867 | 1,089 |
| Afghanistan | 6 | 4 | 3,957 | 4,515 | −558 |
|
Democratic Republic
of the Congo |
7 | 8 | 3,437 | 3,696 | −259 |
| Pakistan | 8 | 6 | 3,332 | 3,953 | −621 |
| Kenya | 9 | 10 | 3,301 | 3,652 | −350 |
| Tanzania | 10 | 14 | 2,994 | 2,836 | 159 |
| Mozambique | 11 | 19 | 2,869 | 2,430 | 439 |
| Türkiye | 12 | 12 | 2,844 | 3,110 | −266 |
| Yemen | 13 | 17 | 2,834 | 2,610 | 224 |
| Indonesia | 14 | 15 | 2,718 | 2,793 | −75 |
| Syria | 15 | 13 | 2,552 | 2,931 | −379 |
| Morocco | 16 | 25 | 2,524 | 2,047 | 477 |
| Philippines | 17 | 23 | 2,376 | 2,183 | 193 |
| Uganda | 18 | 16 | 2,354 | 2,729 | −374 |
| Egypt | 19 | 9 | 2,295 | 3,662 | −1,367 |
| Viet Nam | 20 | 20 | 2,273 | 2,379 | −105 |
Source: OECD DAC
Appendix 2
Table A2: Sector recipients of ODA, 2022
| Sector | Rank 2022 |
Rank
2021 |
2022
(US$m) |
2021
(US$m) |
Change
2021−22 (US$m) |
|---|---|---|---|---|---|
| Health | 1 | 1 | 39,239 | 35,289 | 3,950 |
|
Refugees in
Donor Countries |
2 | 8 | 31,762 | 12,883 | 18,880 |
| Humanitarian | 3 | 2 | 30,634 | 27,835 | 2,799 |
| Infrastructure | 4 | 3 | 30,170 | 22,923 | 7,248 |
|
Governance, civil
society and security |
5 | 4 | 30,016 | 21,525 | 8,491 |
| Other | 6 | 5 | 19,792 | 15,458 | 4,334 |
| Education | 7 | 7 | 15,527 | 13,991 | 1,536 |
|
General
budget support |
8 | 11 | 15,110 | 8,711 | 6,399 |
|
Business and
industry |
9 | 6 | 13,930 | 14,372 | −443 |
|
Agriculture
and food security |
10 | 10 | 11,917 | 11,101 | 817 |
|
Administrative
Costs of Donors |
11 | 9 | 10,972 | 11,417 | −445 |
|
Other social
services |
12 | 12 | 8,317 | 8,664 | −346 |
|
Water and
sanitation |
13 | 13 | 7,007 | 6,330 | 677 |
| Environment | 14 | 14 | 4,615 | 5,313 | -698 |
| Debt relief | 15 | 15 | 375 | 1,507 | −1,132 |
Source: OECD DAC
Notes For more detail on sectors, see this OECD page: https://www.oecd.org/dac/financing-sustainable-development/development-finance-standards/dacandcrscodelists.htm. The ‘other’ sectors includes commodities, multi-sector and unspecified aid.
Downloads
Notes
-
1
Aid grew by 35% between 2005 and 2006 due to a spike in the level of debt relief.Return to source text
-
2
For comparability purposes this calculation removes all aid to Ukraine and all aid to in-donor refugee costs in both 2021 and 2022 from the total amount.Return to source text
-
4
DAC member governments are listed here: https://www.oecd.org/dac/development-assistance-committee/ The figure also includes aid reported by international institutions with governmental membership that conduct all or a significant part of their activities in favour of development and aid recipient countries. https://www.oecd-ilibrary.org/sites/9789264085190-11-en/index.html?itemId=/content/component/9789264085190-11-en#:~:text=In%20DAC%20statistics%2C%20the%20multilateral,development%20and%20aid%20recipient%20countriesReturn to source text
-
5
Yonzan, Gerszon Mahler, Lakner. 2023. Poverty is back to pre-COVID levels globally, but not for low-income countries. World Bank Blogs. Available at: https://blogs.worldbank.org/opendata/poverty-back-pre-covid-levels-globally-not-low-income-countriesReturn to source text
Related content
Kenya’s aid information management: The data landscape
An examination of Kenya's platforms for monitoring and managing aid-funded projects and programmes, with recommendations for integrations and improvements.
National factors helping aid-funded programmes deliver: Kenya, Uganda, Ethiopia
Results from case studies on social protection, agriculture and health, programmes receiving ODA in Kenya, Uganda and Ethiopia
ODA financing the climate–gender–disability interface: Key facts
Donors and African domestic budget allocators must consider the impact of climate change on women and girls with disabilities when making financing decisions
