Analysis of aid flows to Uganda before and during Covid-19
This briefing analyses aid flows from key donors to Uganda before and during Covid-19.
DownloadsKey findings
The following findings are drawn from analysis of aid flows from key donors. For more information, see our box on International Aid Transparency Initiative (IATI) data.
- The overall profile of official development assistance (ODA) is switching from grants to increased proportions of concessional loans, as international financial institution (IFI) lending became a significant source of foreign aid to Uganda in 2020.
- IFI loans consistently increased from 2018 and 2020, with a notable 124% increase between 2019 and 2020.
- Bilateral grants have remained the largest source of aid flows to Uganda, but they have fluctuated between 2018 and 2020, with an 8% increase between 2018 and 2019 followed by a similar (8%) decline between 2019 and 2020.
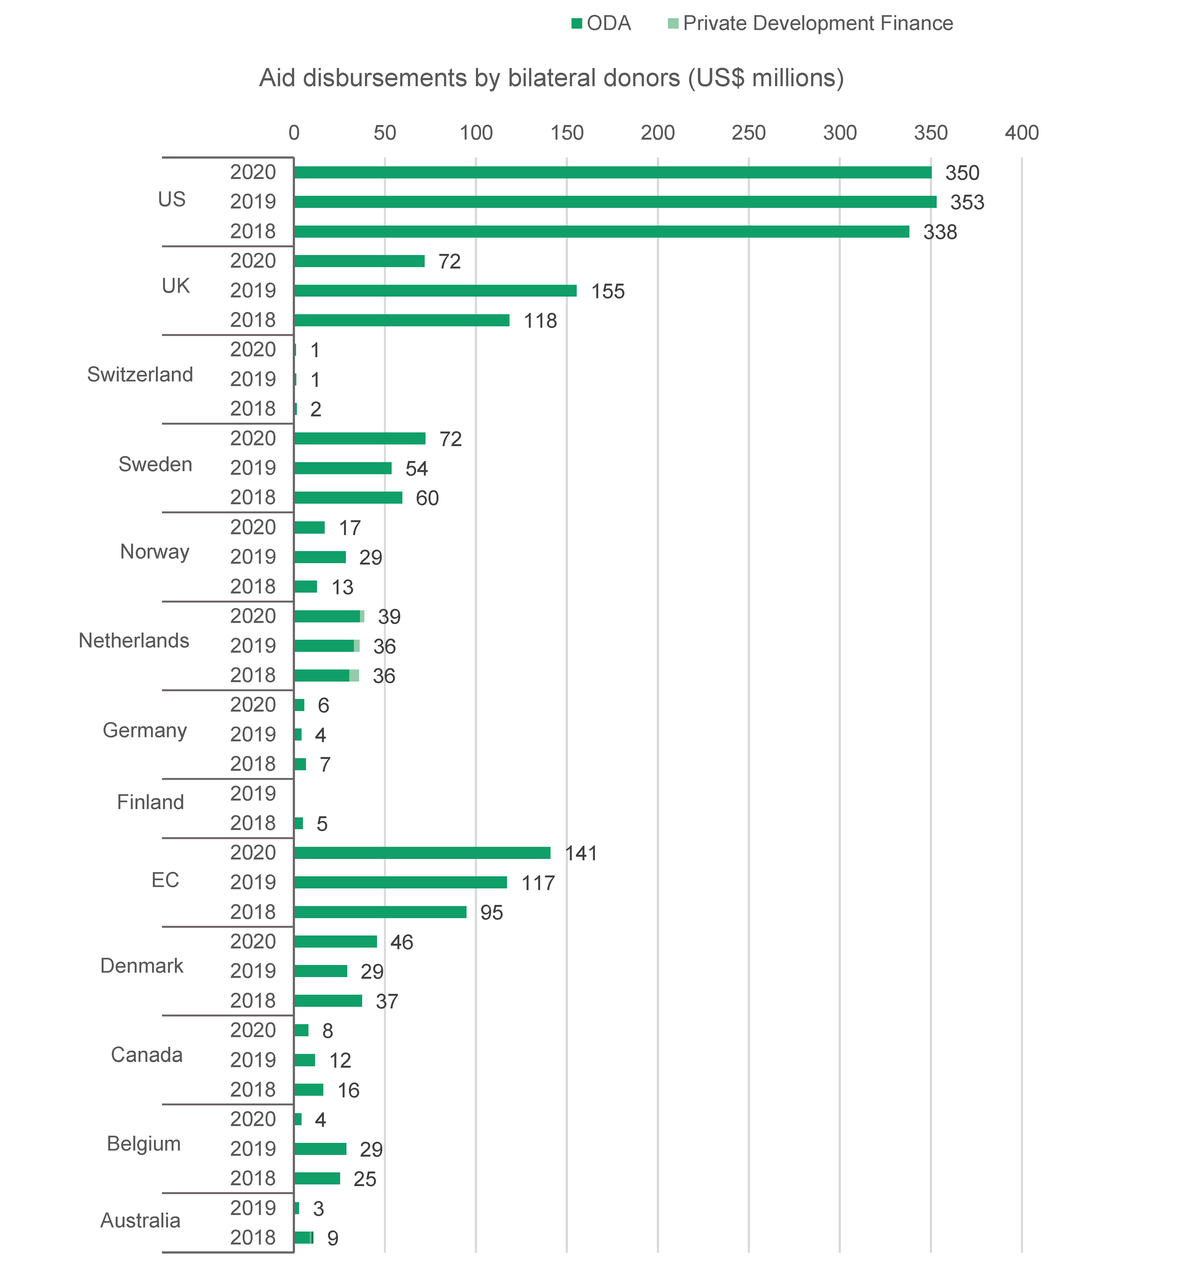
- The US reported the largest increase in bilateral aid flow to Uganda between 2018 and 2020, with a 4% increase from 2018 to 2020 followed by a 1% decline from 2019 to 2020. The second highest aid flow in 2020 was reported by the European Commission (EC) (US$141 million), representing a 20% increase from 2019. Sweden reported the third highest (US$72 million), representing a 36% increase from 2019.
- Aid from the UK was the second highest bilateral aid flow to Uganda in 2019; however, the cut in the UK’s disbursement in 2020 represented the largest (54%) decline in bilateral flows. The sharp decline in bilateral aid from donor countries like the UK can be at least partly attributed to Covid-19 shocks, which had serious implications for donor countries’ economies.
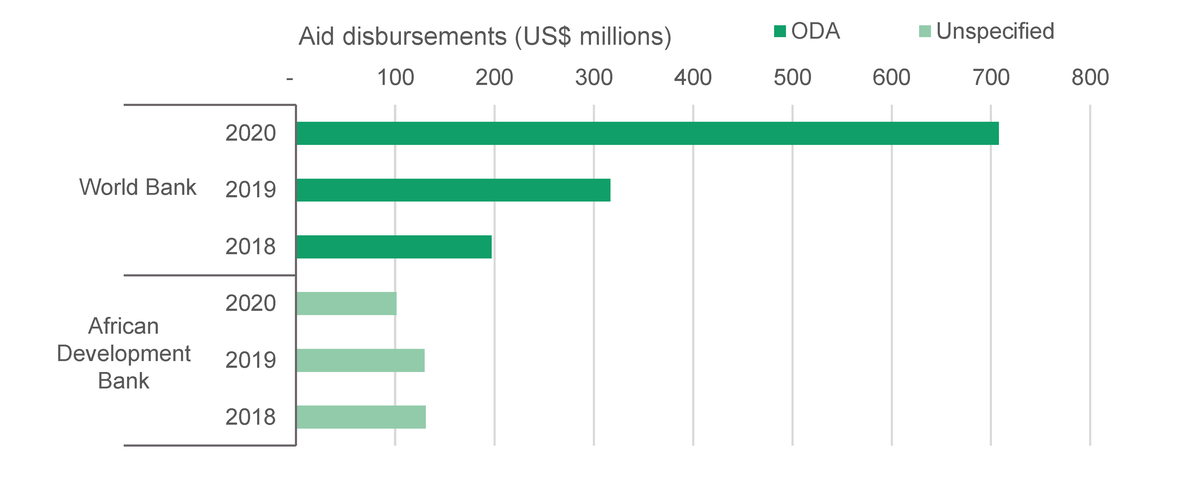
- Growth in IFI aid flows to Uganda between 2018 and 2020 was mainly driven by the World Bank, which contributed 77% of the total reported IFI contributions in the three years reviewed.
- Increase in multilateral aid flows to Uganda in 2020 was at least partly driven by the Global Fund, which more than doubled its disbursements from US$129 million in 2019 to US$261 million in 2020.
- The health sector received the largest share (US$205 million) of bilateral grant aid disbursements in volume terms from bilateral donors in 2020; however, this allocation represents a 10% decline from 2019 to 2020. The allocation to the humanitarian sector in 2020 was US$163 million, representing a 20% decline from 2019 to 2020, while the agriculture and food security sector was allocated US$128 million, representing a 34% increase in allocations from 2019 to 2020.
- The bulk of IFI loans to Uganda in 2020 went to the governance and security sector, which received US$253 million (a 454% increase from 2019), followed by the agriculture and food security sector at US$129 million (a 173% increase from 2019) and infrastructure at US$111 million (a 4% decline).
Introduction
External aid flows form an important source of financing for Uganda, where ODA supports several projects and programmes across various sectors. Aid, especially loans from IFIs, has also helped Uganda to cover budget deficits and shortfalls in revenue collection. Budget deficits were exacerbated by the impact of the Covid-19 pandemic, and were estimated at UGX 3,592 billion or 18% of the government’s target revenue for FY2019-20. [1]
Even before the Covid-19 pandemic, it was widely acknowledged that substantially more financing was needed to deliver the Sustainable Development Goals. [2] Aid alone cannot fill this funding gap. However, aid is a unique form of international financing [3] for supporting the delivery of global goals because of its ability to be directly targeted at the world’s poorest and most vulnerable people.
Improvements in the publishing of aid flow data over the past two years by many bilateral donors, IFIs and multilateral agencies publishing to IATI provides new opportunities for near real-time data on aid; [4] however, verified data from the Organisation for Economic Co-operation and Development Assistance Committee (OECD DAC) on sectors and recipient countries will only be available from January 2022. This analysis, therefore, relies on disbursement data sourced from IATI with a focus on spending by donor type and flow type, leading institutions and sectoral allocations.
While it is not possible to see a complete picture of the aid situation in Uganda due to poor IATI publishing by some donors, the analysis in this briefing reliably indicates what is happening to approximately two-thirds of total bilateral aid and almost all IFI aid. Multilateral data is less available through IATI, and these limitations are recognised throughout the analysis. The available data is enough to shed light on how Uganda’s aid landscape is changing and support decisions about aid spending during the pandemic. It makes it possible to set out what action is needed from donors to enable an inclusive recovery from the pandemic and ensure their commitments are supporting ambitions to end poverty and leave no one behind.
Box 1
Important note about the aid data used in this briefing
This analysis relies on data published by donors to IATI – a major source of near real-time disbursements of aid. In this paper, we look at all disbursements – ODA, non-concessional Other Official Flows (OOF) and other flows to show what funding has crossed into the country and how activities on the ground are affected. The data in this briefing comprises all disbursements made by a consistent set of donors, detailed in Table A1 in the Appendix, for January to December 2018 to 2020, and relies on data published by these donors up until March 2021 (on the basis that most publish their disbursement data within three months of the period in question).
It is possible that more transactions made in 2020 will be published to IATI after this briefing; however, this is likely to have minimal impact on the findings based on the publishing habits of donors to date. This briefing therefore provides a picture based on what was published at a single point in time, compared to the same publishing period the year before by the same set of donors. As not all donors publish to IATI, this analysis focuses on how disbursements have changed, rather than total flows.
As multiple donors may publish on the same activity, our analysis looks at bilateral donors, IFIs and multilateral institutions separately to avoid double counting issues throughout. For the full list of donors included in this analysis, see Table A1.
Disbursements by donor type
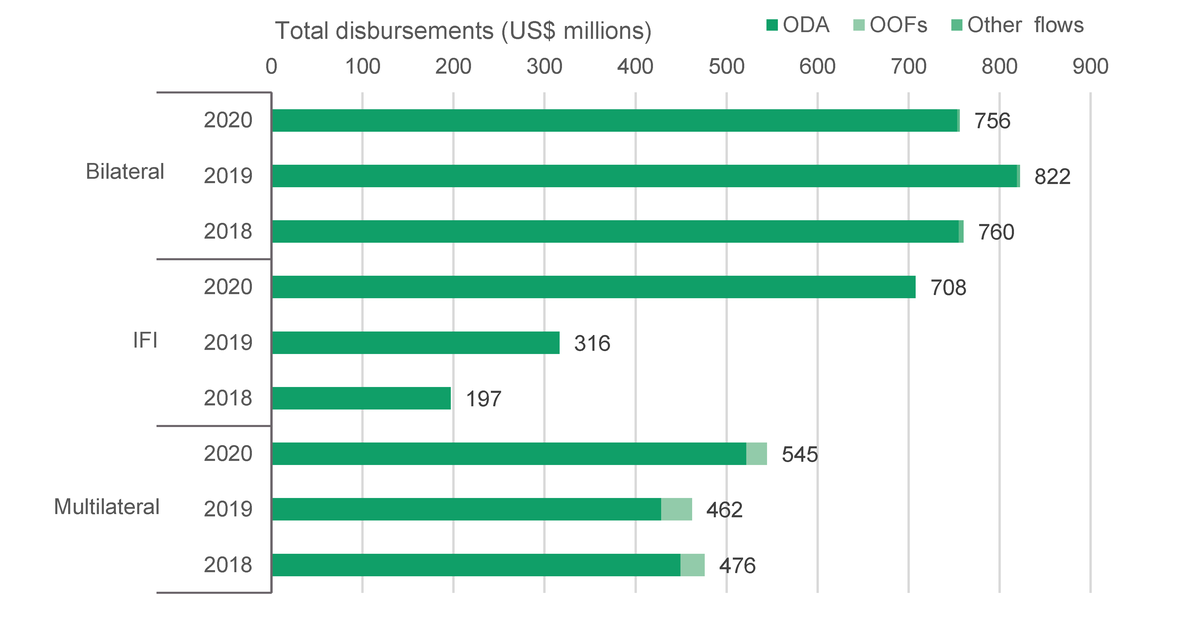
There was fluctuation in bilateral and multilateral aid as disbursements from IFIs grew substantially from 2018 to 2020 (Figure 1).
Figure 1: Aid disbursements from key bilateral donors, IFIs and multilateral organisations, January to December, 2018 to 2020
| ODA | OOFs |
Other
flows |
Total | ||
|---|---|---|---|---|---|
| Multilateral | 2018 | 450 | 27 | 0 | 476 |
| 2019 | 428 | 34 | 0 | 462 | |
| 2020 | 522 | 23 | 0 | 545 | |
| IFI | 2018 | 197 | 0 | 0 | 197 |
| 2019 | 316 | 0 | 0 | 316 | |
| 2020 | 708 | 0 | 0 | 708 | |
| Bilateral | 2018 | 755 | 0 | 5 | 760 |
| 2019 | 819 | 0 | 3 | 822 | |
| 2020 | 753 | 0 | 3 | 756 |
Source: Development Initiatives based on IATI data.
Notes: IFI = international financial institution; OOFs = Other Official Flows. See Table A1 for the full list of bilateral donors, IFIs and multilateral institutions.
Disbursements by aid flow type
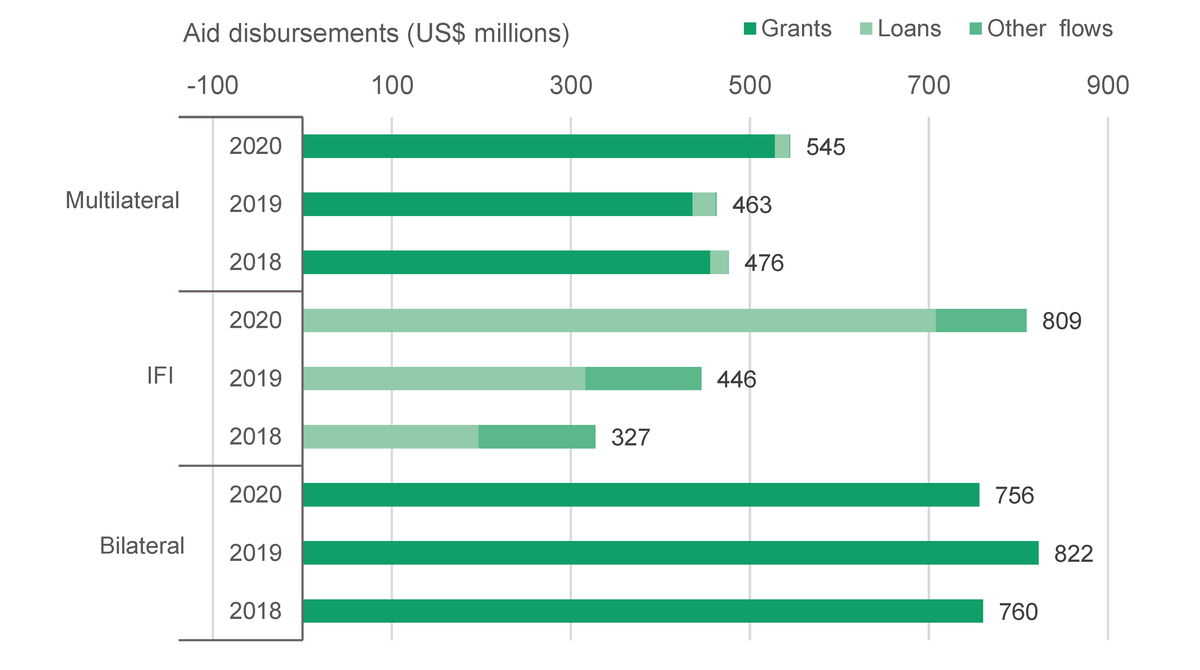
Aid disbursements in grants from bilateral donors have shrunk as a proportion of total aid disbursements from 2019 to 2020, while the proportion of loans from IFIs significantly increased from 2018 to 2020 (Figure 2).
Figure 2: Aid disbursements by key bilateral donors, IFIs and multilateral institutions by flow type, January to December, 2018 to 2020
| Grants | Loans | Other flows | Total | ||
|---|---|---|---|---|---|
| Bilateral | 2018 | 760 | 0 | 0 | 760 |
| 2019 | 822 | 0 | 0 | 822 | |
| 2020 | 756 | 0 | 0 | 756 | |
| IFI | 2018 | 0 | 197 | 131 | 327 |
| 2019 | 0 | 316 | 129 | 446 | |
| 2020 | 0 | 708 | 101 | 809 | |
| Multilateral | 2018 | 456 | 20 | 0 | 476 |
| 2019 | 436 | 26 | 1 | 463 | |
| 2020 | 528 | 16 | 1 | 545 |
Source: Development Initiatives based on IATI data.
Notes: IFI = international financial institution. See Table A1 for the full list of bilateral donors, IFIs and multilateral institutions.
Donors and institutions driving the trends in aid disbursements
Bilateral aid
Amid a pandemic and its pressure on service delivery, aid disbursements from Uganda’s biggest bilateral donor (the US) remained largely constant in 2020 compared to 2019. Bilateral aid flows from the European Commission (EC) increased significantly between 2018 and 2020, while other donors like the UK, Norway and Belgium made significant cuts in disbursements (Figure 3).
Figure 3: Bilateral donor aid disbursements, January to July, 2018 to 2020
| ODA | Private Development Finance | Grand Total | ||
|---|---|---|---|---|
| Australia | 2018 | 9 | 0 | 9 |
| 2019 | 3 | 0 | 3 | |
| Belgium | 2018 | 25 | 0 | 25 |
| 2019 | 29 | 0 | 29 | |
| 2020 | 4 | 0 | 4 | |
| Canada | 2018 | 16 | 0 | 16 |
| 2019 | 12 | 0 | 12 | |
| 2020 | 8 | 0 | 8 | |
| Denmark | 2018 | 37 | 0 | 37 |
| 2019 | 29 | 0 | 29 | |
| 2020 | 46 | 0 | 46 | |
| EC | 2018 | 95 | 0 | 95 |
| 2019 | 117 | 0 | 117 | |
| 2020 | 141 | 0 | 141 | |
|
Fin
land |
2018 | 5 | 0 | 5 |
| 2019 | 0 | 0 | 0 | |
| Germany | 2018 | 7 | 0 | 7 |
| 2019 | 4 | 0 | 4 | |
| 2020 | 6 | 0 | 6 | |
|
Nether
lands |
2018 | 30 | 5 | 36 |
| 2019 | 33 | 3 | 36 | |
| 2020 | 36 | 2 | 39 | |
| Norway | 2018 | 13 | 0 | 13 |
| 2019 | 29 | 0 | 29 | |
| 2020 | 17 | 0 | 17 | |
| Sweden | 2018 | 60 | 0 | 60 |
| 2019 | 54 | 0 | 54 | |
| 2020 | 72 | 0 | 72 | |
|
Switzer
land |
2018 | 2 | 0 | 2 |
| 2019 | 1 | 0 | 1 | |
| 2020 | 1 | 0 | 1 | |
| UK | 2018 | 118 | 0 | 118 |
| 2019 | 155 | 0 | 155 | |
| 2020 | 72 | 0 | 72 | |
| US | 2018 | 338 | 0 | 338 |
| 2019 | 353 | 0 | 353 | |
| 2020 | 350 | 0 | 350 |
Source: Development Initiatives based on IATI data.
International financial institutions
The significant amount of ODA from the Word Bank in 2020 drove the increase in IFI disbursements to Uganda in 2020 (Figure 4).
Figure 4: IFI aid disbursements, January to July, 2018 to 2020
Multilateral institutions
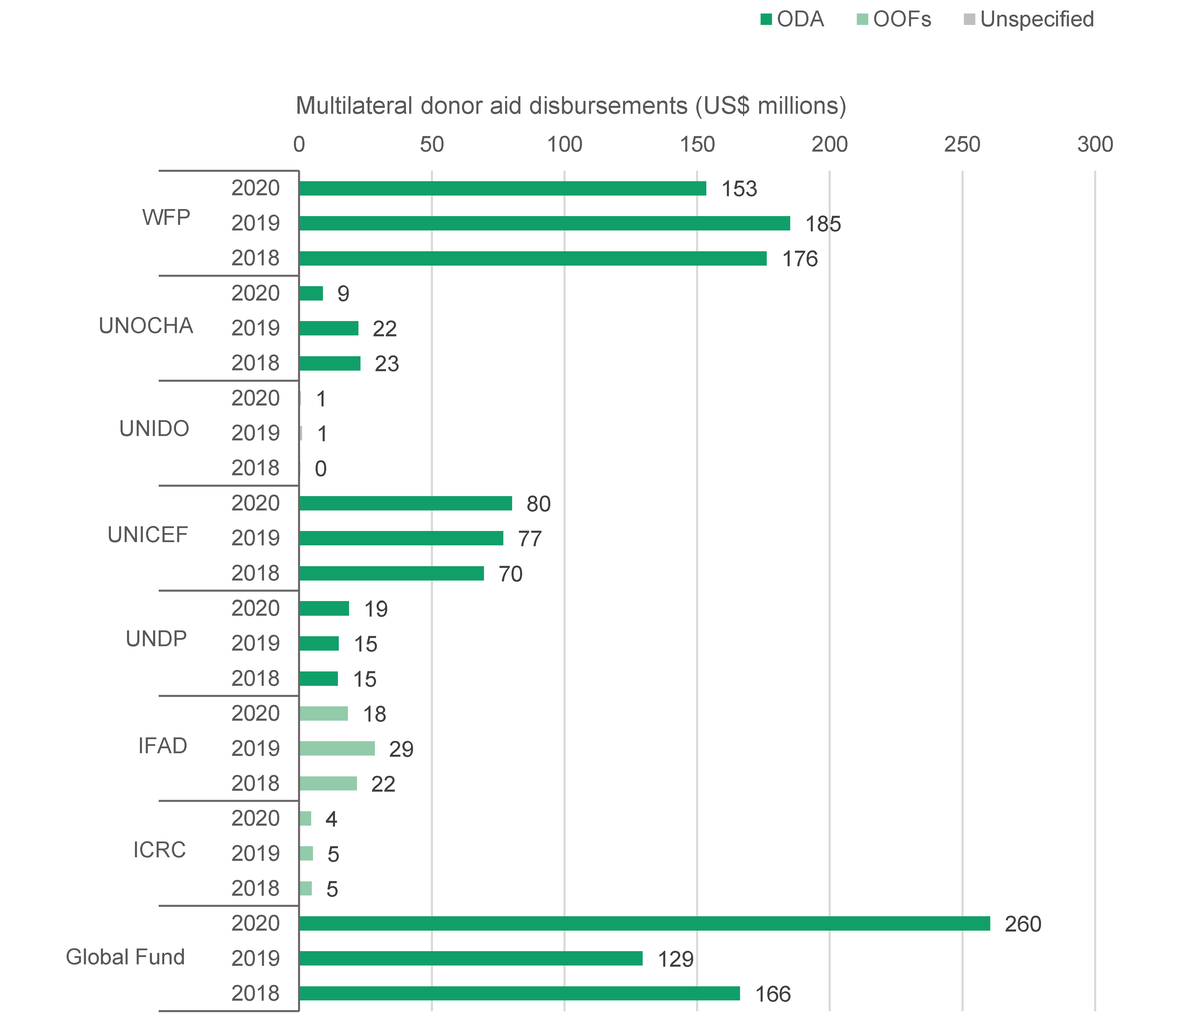
There is limited real-time data for the activities of multilateral institutions. Of those for whom data does exist, eight donors, including the Global Fund, drove the increase in multilateral donor aid disbursements to Uganda in 2020 (Figure 5).
Figure 5: Multilateral aid disbursements, January to July, 2018 to 2020
| ODA | OOFs | Unspecified | Total | ||
|---|---|---|---|---|---|
| Global Fund | 2018 | 166 | 0 | 0 | 166 |
| 2019 | 129 | 0 | 0 | 129 | |
| 2020 | 260 | 0 | 0 | 260 | |
| ICRC | 2018 | 0 | 5 | 0 | 5 |
| 2019 | 0 | 5 | 0 | 5 | |
| 2020 | 0 | 4 | 0 | 4 | |
| IFAD | 2018 | 0 | 22 | 0 | 22 |
| 2019 | 0 | 29 | 0 | 29 | |
| 2020 | 0 | 18 | 0 | 18 | |
| UNDP | 2018 | 15 | 0 | 0 | 15 |
| 2019 | 15 | 0 | 0 | 15 | |
| 2020 | 19 | 0 | 0 | 19 | |
| UNICEF | 2018 | 70 | 0 | 0 | 70 |
| 2019 | 77 | 0 | 0 | 77 | |
| 2020 | 80 | 0 | 0 | 80 | |
| UNIDO | 2018 | 0 | 0 | 0 | 0 |
| 2019 | 0 | 0 | 1 | 1 | |
| 2020 | 0 | 0 | 1 | 1 | |
| UNOCHA | 2018 | 23 | 0 | 0 | 23 |
| 2019 | 22 | 0 | 0 | 22 | |
| 2020 | 9 | 0 | 0 | 9 | |
| WFP | 2018 | 176 | 0 | 0 | 176 |
| 2019 | 185 | 0 | 0 | 185 | |
| 2020 | 153 | 0 | 0 | 153 |
Source: Development Initiatives based on IATI data.
What is the sector focus of aid disbursements from 2018 to 2020?
Bilateral donors
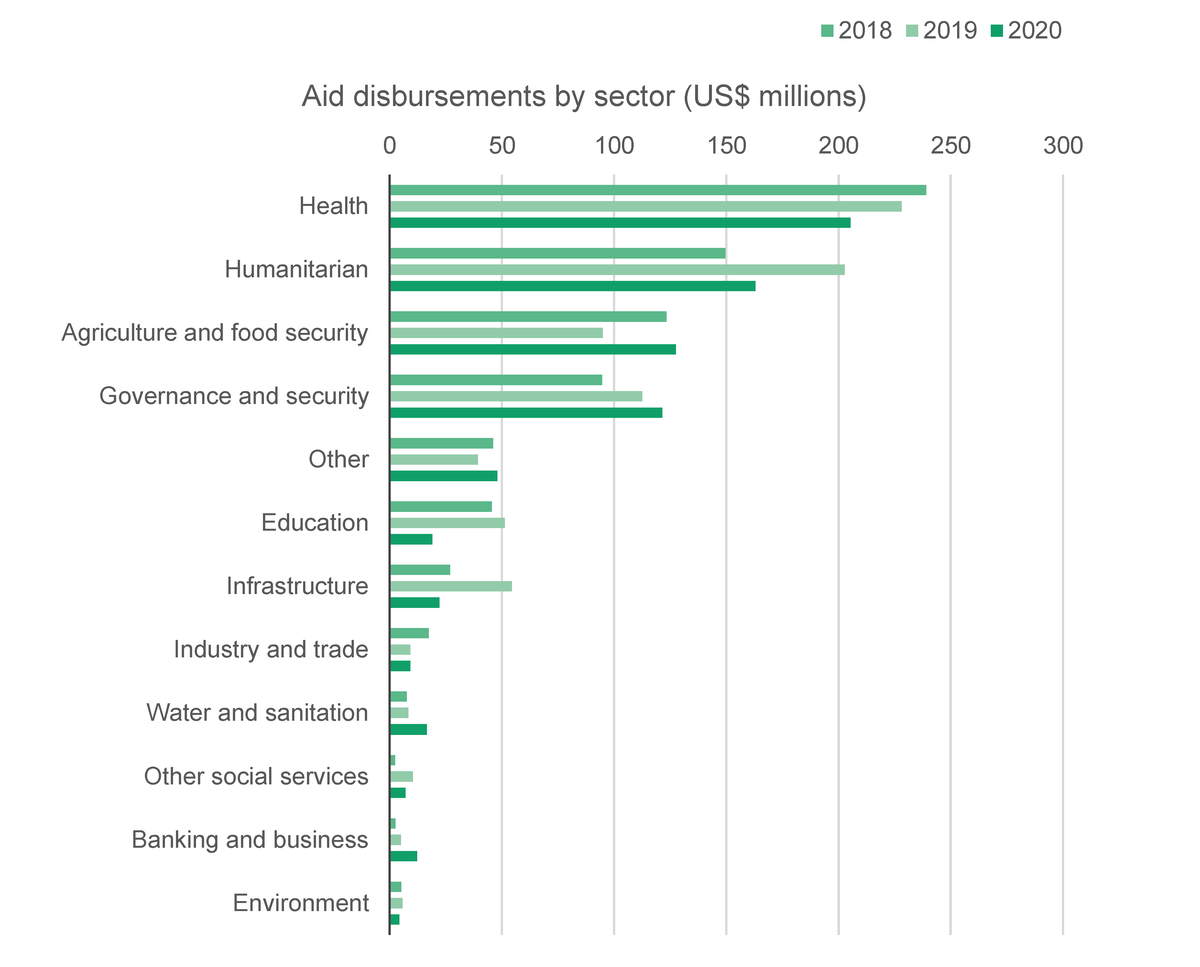
- The health sector received the largest share (US$205 million) of bilateral grant aid disbursements in volume terms from bilateral donors in 2020. However, this allocation represents a 10% decline from 2019 to 2020. The allocation to the humanitarian sector in 2020 was US$163 million, representing a 20% decline from 2019 to 2020, while the agriculture and food security sector was allocated US$128 million, representing a 34% increase from 2019 to 2020.
- The education sector was allocated US$19 million in bilateral grant aid in 2020. This represents the most significant decline in sector aid disbursement, of 63% from 2019 to 2020, followed by infrastructure, which was allocated US$22 million in bilateral grant aid, representing a 59% decline in the same period.
- Bilateral aid disbursements to the governance and security sector also increased over the same period (Figure 6).
Figure 6: Bilateral aid disbursements by sector, January to December, 2018 to 2020
| 2020 | 2019 | 2018 | Total | |
|---|---|---|---|---|
| Unspecified | 0 | 0 | 0 | 0.0 |
| Environment | 4 | 6 | 5 | 15.2 |
| Banking and business | 12 | 5 | 3 | 19.8 |
| Other social services | 7 | 10 | 2 | 19.8 |
| Water and sanitation | 17 | 8 | 8 | 32.6 |
| Industry and trade | 9 | 9 | 17 | 35.9 |
| Infrastructure | 22 | 54 | 27 | 103.6 |
| Education | 19 | 51 | 46 | 115.8 |
| Other | 48 | 39 | 46 | 133.4 |
| Governance and security | 121 | 113 | 95 | 328.7 |
| Agriculture and food security | 128 | 95 | 123 | 345.9 |
| Humanitarian | 163 | 203 | 150 | 515.4 |
| Health | 205 | 228 | 239 | 672.5 |
Source: Development Initiatives based on IATI data.
Notes: ‘Other’ includes the administrative cost of donors, other multisector allocations, and unallocated or unspecified disbursements.
International financial institutions
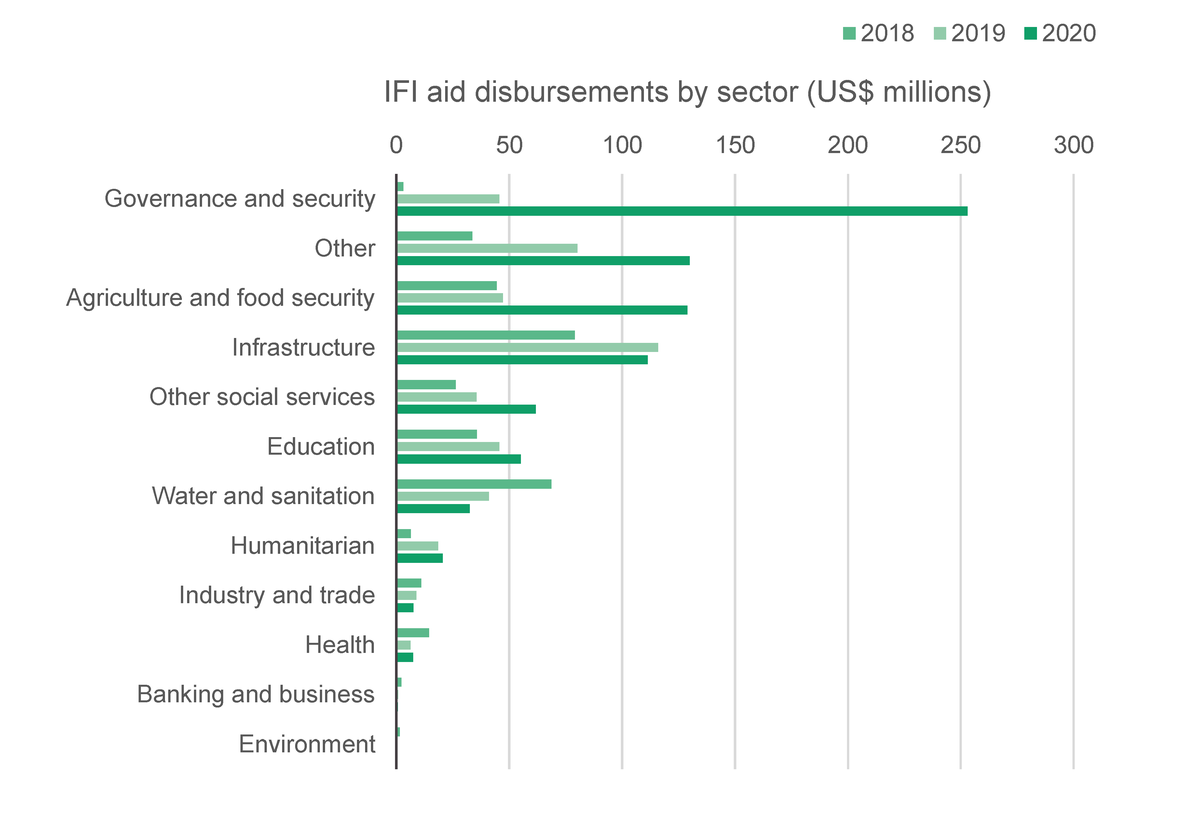
- The bulk of IFI loans to Uganda in 2020 went to the governance and security sector, which received US$253 million (a 454% increase from 2019), followed by agriculture and food security at US$129 million (a 173% increase from 2019) and infrastructure at US$111 million (a 4% decline).
- Water and sanitation, on the other hand, experienced a 21% decline in aid disbursements from 2019 to 2020.
- The proportional increase in disbursements to the humanitarian and other social services sectors from 2019 to 2020 is also significant.
- The sector allocation of IFI flows contrasts with the allocations of bilateral and multilateral aid, with significant difference in health and humanitarian sectors prioritised by bilateral and multilateral donors while IFIs prioritised governance and security (Figure 7).
Figure 7: IFI aid disbursements by sector, January to December, 2018 to 2020
| 2020 | 2019 | 2018 | Grand Total | |
|---|---|---|---|---|
| Environment | 0 | 0 | 2 | 2 |
| Banking and business | 1 | 1 | 2 | 4 |
| Health | 7 | 6 | 15 | 28 |
| Industry and trade | 8 | 9 | 11 | 28 |
| Humanitarian | 21 | 19 | 6 | 46 |
| Water and sanitation | 32 | 41 | 69 | 142 |
| Education | 55 | 46 | 36 | 137 |
| Other social services | 62 | 36 | 26 | 124 |
| Infrastructure | 111 | 116 | 79 | 306 |
| Agriculture and food security | 129 | 47 | 44 | 221 |
| Other | 130 | 80 | 34 | 244 |
| Governance and security | 253 | 46 | 3 | 302 |
Source: Development Initiatives based on IATI data.
Note: ‘Other’ includes the administrative cost of donors, other multisector allocations, and unallocated or unspecified disbursements.
Multilateral donors
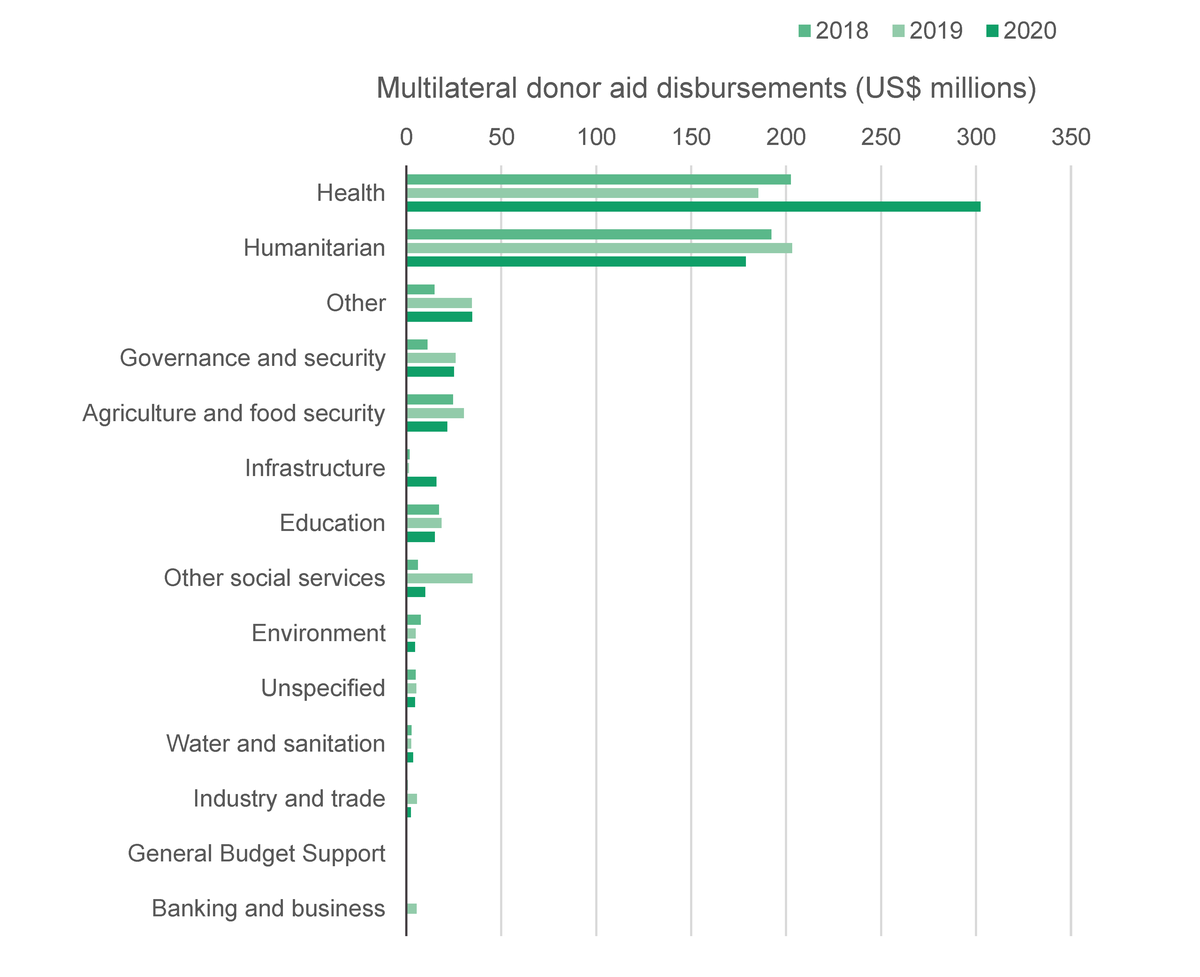
There is limited real-time data for the activities of multilateral institutions. From the data that is available, it is clear that the health sector received the largest share of multilateral aid disbursements in 2020 at US$266 million, representing a 63% increase from the previous year. This consisted mostly of disbursement increases by the Global Fund. The agriculture and food security sector and the humanitarian sector saw cuts in multilateral donor aid disbursements of 29% and 12% respectively from 2019 to 2020 (Figure 8).
- Multilateral donors’ sector prioritisations mirror those of bilateral donors.
- Multilateral donors prioritised allocations to the health, humanitarian and agriculture and food security sectors in the three years reviewed.
- Only one of those three sectors – health – had its allocations increased consistently in the three years reviewed (2019, 5% and 2020, 1%).
- Allocations to the humanitarian sector dropped by 11% in 2019, before increasing by 19% in 2020. Contributions to the agricultural sector increased by 14% in 2019 and dropped by 28% in 2020.
- Significant increases were witnessed in the water and sanitation sector, whose allocations increased by 57% in 2019 and 48% in 2020. It should be noted that although the increase in 2020 represents the highest percentage increase in all the sectors in 2020, in volume terms the increase is very small. Other significant increases included the industry and trade sector at 1,307% in 2019; however, allocations dropped by 79% in 2020 (Figure 8).
Figure 8: Multilateral donor aid disbursements by sector, January to December, 2018 to 2020
| 2020 | 2019 | 2018 | Grand Total | |
|---|---|---|---|---|
| Banking and business | 0 | 5 | 0 | 6 |
| General Budget Support | 0 | 0 | 0 | 0 |
| Industry and trade | 2 | 5 | 1 | 8 |
| Water and sanitation | 3 | 3 | 3 | 9 |
| Unspecified | 4 | 5 | 5 | 14 |
| Environment | 5 | 5 | 8 | 17 |
| Other social services | 10 | 35 | 6 | 51 |
| Education | 15 | 18 | 17 | 51 |
| Infrastructure | 16 | 1 | 2 | 19 |
| Agriculture and food security | 21 | 30 | 25 | 76 |
| Governance and security | 25 | 26 | 11 | 62 |
| Other | 35 | 35 | 15 | 84 |
| Humanitarian | 179 | 203 | 192 | 574 |
| Health | 302 | 185 | 202 | 690 |
Source: Development Initiatives based on IATI data.
Note: ‘Other’ includes the administrative cost of donors, other multisector allocations, and unallocated or unspecified disbursements.
Conclusion and recommendations
Through the analysis of real-time data published to IATI, this paper has highlighted several trends emerging in 2020, including aid disbursements, scale, types of aid flows and sector priorities. Overall conclusions from the analysis are as follows.
- Bilateral aid disbursements from key donors like the UK declined in 2020 compared to 2019, while disbursements from the US (Uganda’s largest bilateral donor) remained constant. In contrast, aid from the EC, Sweden and Denmark increased.
- IFIs significantly increased aid disbursements in 2020, driven by the World Bank.
- Total aid disbursements to the health sector declined in 2020, while disbursements to the governance and security sector by IFIs and bilateral donors increased significantly.
- The share of grants in aid disbursements to Uganda fell in 2020. At the same time, the share of loans increased. This change in aid composition is driven by rising IFI loans against declining bilateral grant disbursements.
- Aid in grants has not helped to narrow Uganda’s financing gap. Instead, loans from IFIs have gained prominence as a source of external financing, with the concerning outcome of further increases in Uganda’s debt-to-GDP ratio, which is now heading into unsustainable regions.
The following recommendations could help Uganda to address the debt challenges associated with increasing loans and declining grant disbursements.
- More ODA could be directed at supporting reforms in tax policy and revenue administration geared towards improving overall revenue collection. For example, widening the tax base through implementation of progressive measures, as well as improvement of efficiency in tax collection, would significantly reduce shortfalls in revenue collection and the need to borrow from IFIs.
- The sector focus of external aid flows needs to be balanced, with particular attention given to economic recovery and addressing the impact of Covid-19, especially on the poorest. In this regard, the health, humanitarian, education and social services sectors, which saw cuts in allocations from bilateral donors in 2020, could be the focus of increased allocations in subsequent disbursements.
Appendix
Table A1: Key bilateral donors, IFIs and multilateral institutions used in the analysis of IATI disbursements
| Bilateral donors |
International financial
institutions (IFIs) |
Multilateral
institutions |
|---|---|---|
| Australian Aid | African Development Bank Group (AfDB) | The Global Fund |
| Belgium – Directorate-General for Development Cooperation and Humanitarian Aid (DGD) | The World Bank | International Fund for Agricultural Development (IFAD) |
| Canada – Foreign Affairs, Trade and Development (DFATD) | United Nations Development Programme (UNDP) | |
| Denmark – Ministry of Foreign Affairs | UNOCHA – Central Emergency Response Fund (CERF) | |
| European Commission (EC) – Development and Cooperation – EuropeAid | United Nations International Children’s Education Fund (UNICEF) | |
| EC – Service for Foreign Policy Instruments (FPI) | United Nations World Food Program (WFP) | |
| EC – European Civil Protection and Humanitarian Aid Operations (ECHO) | ||
| Finland – Ministry for Foreign Affairs | ||
| Germany – Federal Foreign Office | ||
| Netherlands – Enterprise Agency (RvO) | ||
|
Netherlands – Ministry of Foreign Affairs
(DGIS) |
||
| Norway – Norway Agency for Development Cooperation (Norad) | ||
| Sweden – Swedish International Development Cooperation Agency (Sida) | ||
| Switzerland – Swiss Agency for Development and Cooperation (SDC) | ||
| UK – British Council | ||
| UK – Department for Business, Energy and Industrial Strategy (BEIS) | ||
| UK – Department of Health and Social Care (DHSC) | ||
| UK – Foreign, Commonwealth and Development Office (FCDO) | ||
| US – US Agency for International Development (USAID) |
Downloads
Notes
-
1
Uganda Revenue Authority (URA) reports its revenue data in terms of net revenue (target, actual and variance). Net revenue is what was collected less tax refunds.Return to source text
-
2
Inter-agency Task Force on Financing for Development, 2019. Financing for Sustainable Development Report. Available at: https://developmentfinance.un.org/fsdr2019Return to source text
-
3
Development Initiatives, 2018. Investments to End Poverty, Chapter 2. Available at: www.devinit.org/resources/investments-end-poverty-2018/strengthening-critical-role-aidReturn to source text
-
4
‘Aid’ is used as a catch-all term in the IATI context to capture all humanitarian and development assistance. This means aid, in this context, is much broader than the narrower ODA definition used by the Organisation for Economic Co-operation and Development Assistance Committee (OECD DAC) and includes other official flows (OOFs) and any other development flows reported by official actors to IATI. See the methodology annex for further information.Return to source text
Related content
Targeting Covid-19 relief in Uganda: The role of data, statistics and evidence
In this webinar a range of speakers discuss the role of data in targeting social safety nets in Uganda, an issue that is coming strongly to the fore with the impacts of Covid-19 on Uganda's poorest communities.
Domestic financial flows in Uganda before and during Covid-19
This briefing tracks domestic revenue and spending to key pro-poor sectors in Uganda before and during the Covid-19 pandemic.
Socioeconomic impact of Covid-19 in Uganda: How has the government allocated public expenditure for FY2020/21?
How will the Covid-19 pandemic affect people living in poverty in Uganda? This report looks at the Ugandan government's response measures in health, food, and water, sanitation and hygiene.
