Climate finance: Earning trust through consistent reporting: Chapter 3
Climate finance reporting: A quantitative review
This chapter examines the state of the data on climate finance reported by providers and highlights worrying trends. It shows that climate finance has not been measured consistently across years or providers, and that we know less than we think about how climate finance has changed over time, or who has provided it.
Inconsistency in climate finance measurements over time
As noted in Chapter 1 , one of the most important objectives in measuring climate finance is understanding how it is scaling up in response to political commitments and growing recognition of developing countries’ needs. Knowing this depends on consistent measurement over time, but there is substantial evidence that the way that countries have reported climate finance has changed over time. One study even found examples of projects that had been ‘relabelled’ as climate finance halfway through. [1]
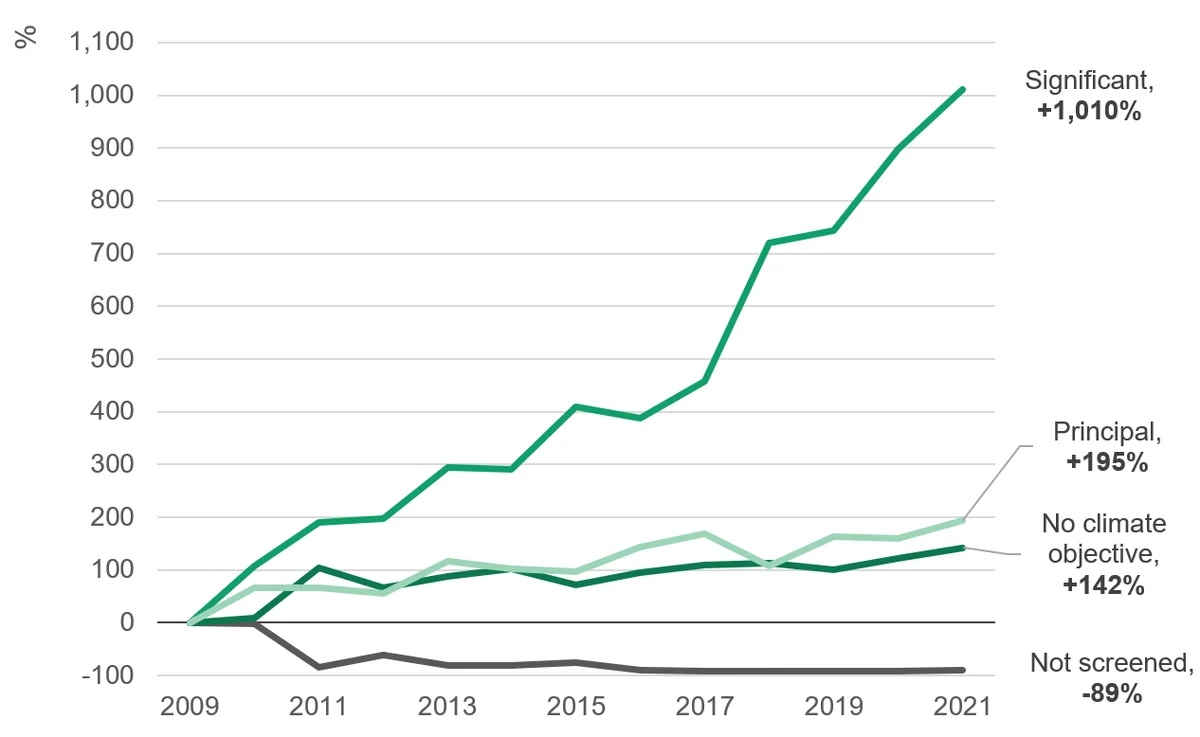
Since 2009, there has been a dramatic increase in the share of bilateral ODA expenditure graded with a significant or principal Rio marker, from 7% to 27%. On the face of it, this indicates a large shift towards spending ODA on climate finance. The Rio markers – the pros and cons of which are explored in the next chapter – are the most common way that developed countries denote which projects are climate finance. Principal-marked projects are those for which climate objectives are the fundamental purpose (the project would not have happened without them), whereas significant-marked projects have been meaningfully altered to address climate goals, among other goals (the project would have happened anyway).
The vast majority of the increase has come from projects with a significant marker, meanwhile, expenditure on projects with a principal marker has grown at roughly the same rate as total bilateral ODA. The lower bar for counting a project as significant means there is more subjectivity around the application of this marker. Previous studies have found that significant-marked projects are most likely to be wrongly categorised. [2]
Figure 3.1: Most of the increase in climate finance comes from the ‘significant’ marker, which is also the most prone to misapplication
Change in bilateral ODA expenditure by marker since 2009
placeholder
Source: Development Initiatives’ analysis of OECD CRS data.
Notes: This chart includes gross disbursements of bilateral ODA from all DAC providers. Projects are classified according to their maximum marker, i.e., if a project is not screened for mitigation but has a significant adaptation marker it is counted as significant, or if it has a significant adaptation marker but a principal mitigation marker it is counted as principal, etc.
Decline in unscreened ODA
Most countries do not count the full value of significant-marked ODA as climate finance when reporting to the UNFCCC. Assuming that 40% of significant-marked ODA counts towards climate finance, as a rough approximation, [3] suggests that bilateral climate finance funded from ODA rose from US$4.5 billion to US$22.4 billion between 2009 and 2022, roughly a five-fold increase.
However, during this period there was also a large change in the share of ‘unscreened’ ODA – that which was not assessed for its impact on mitigation or adaptation objectives using Rio markers. In 2009, US$37.4 billion [4] was unscreened, and this fell to US$4.0 billion in 2021. It is almost certainly the case that of that US$37.4 billion, some projects would have been counted as climate finance if they had been screened. For example, one project in 2009 aimed at “reforestation for renewable energy in Rwanda”, [5] and a project in 2011 was entitled “pilot programme for integrated adaptation strategy”. [6] Neither was tagged as mitigation or adaptation. This suggests that in this sense climate finance reporting has become more accurate over time – at least some projects that should have been counted now are included. At the same time, it means we do not know how much more we are spending now, compared to 2009. Assuming that the split between markers would have been the same for unscreened ODA, [7] it would suggest that the total increase has only been from US$8.9 billion to US$24.1 billion, just under a three-fold increase (compared to a five-fold increase otherwise).
Increase in markings within specific sectors
More tentative evidence of a change in reporting practice comes from examining the increase in the use of markers in specific sectors where one would expect the vast majority of ODA would be marked a certain way today. If the share of ODA within a certain sector that has a marker applied has grown substantially, this does not necessarily imply a change in how projects tend to be marked: it could represent a genuine reorientation within the sector towards more climate-relevant action. However, for sectors such as solar energy, where all ODA is marked as mitigation today, it is reasonable to assume that solar projects not marked as mitigation in the past would have had a different marking today.
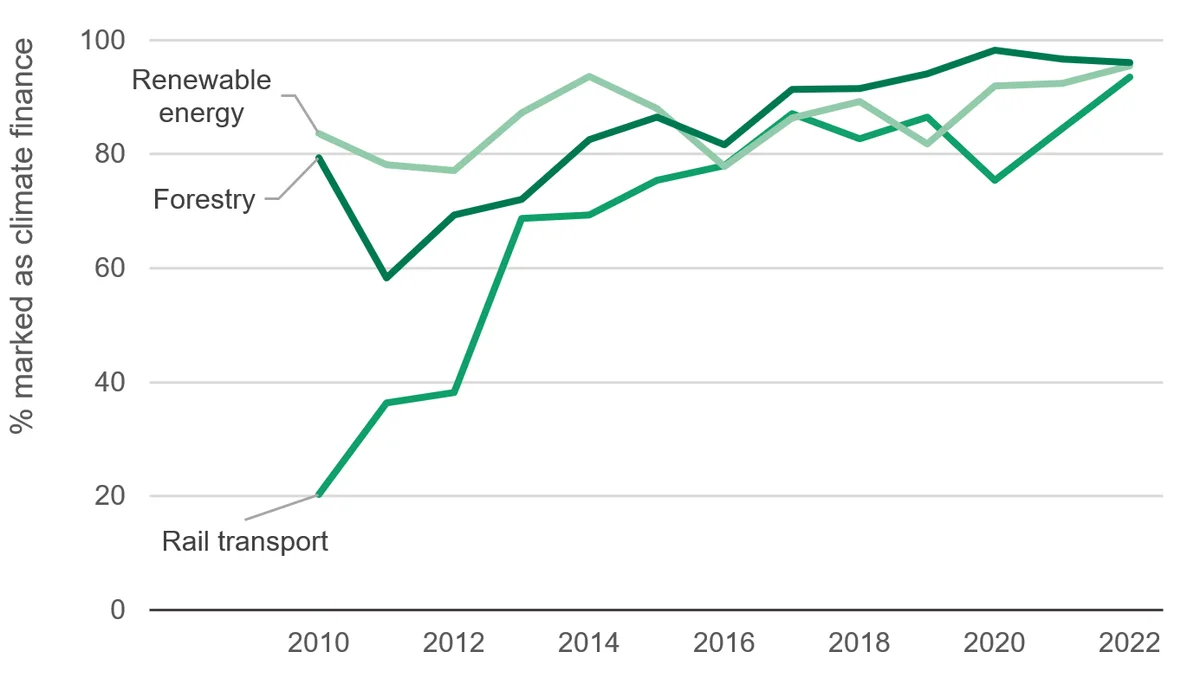
For example, today, multiple countries count 100% of ODA to the rail sector as mitigation, but this percentage has trended upwards over time (even excluding unscreened ODA). If these countries had always counted 100% of rail transport projects, this would have reduced the increase in climate finance since 2010 by around US$850 million. As with unscreened ODA, this may represent an improvement in accuracy (or not) but nevertheless suggests that the upwards trend in climate finance is lower than we think.
Figure 3.2: Average share of expenditure marked as climate finance approaches 100% in some sectors
Change in share of bilateral ODA marked as climate by sector (excluding unscreened ODA)
placeholder
Source: Development Initiatives’ analysis of OECD CRS data.
Notes: The chart shows gross ODA disbursements within the sector with a significant or principal marker as a share of all screened ODA expenditure in the sector. Unscreened ODA is excluded to eliminate reclassifications that come from an increase in screening for climate focus, discussed above.
While large changes in the percentage of Rio-marked ODA within sectors is suggestive of a change in reporting practice (especially when sectors are narrowly defined), it may nevertheless reflect genuine change in providers’ climate focus. However, there is also evidence from machine learning techniques (an approach revisited later in this chapter) that reporting practices have changed. By training a model to analyse providers’ project descriptions over recent years, it is possible to predict which projects will be classified as climate finance (in those years) with a high degree of accuracy. Applying that model to previous years allows us to assess how past projects would have been classified if judged using the provider’s current approach.
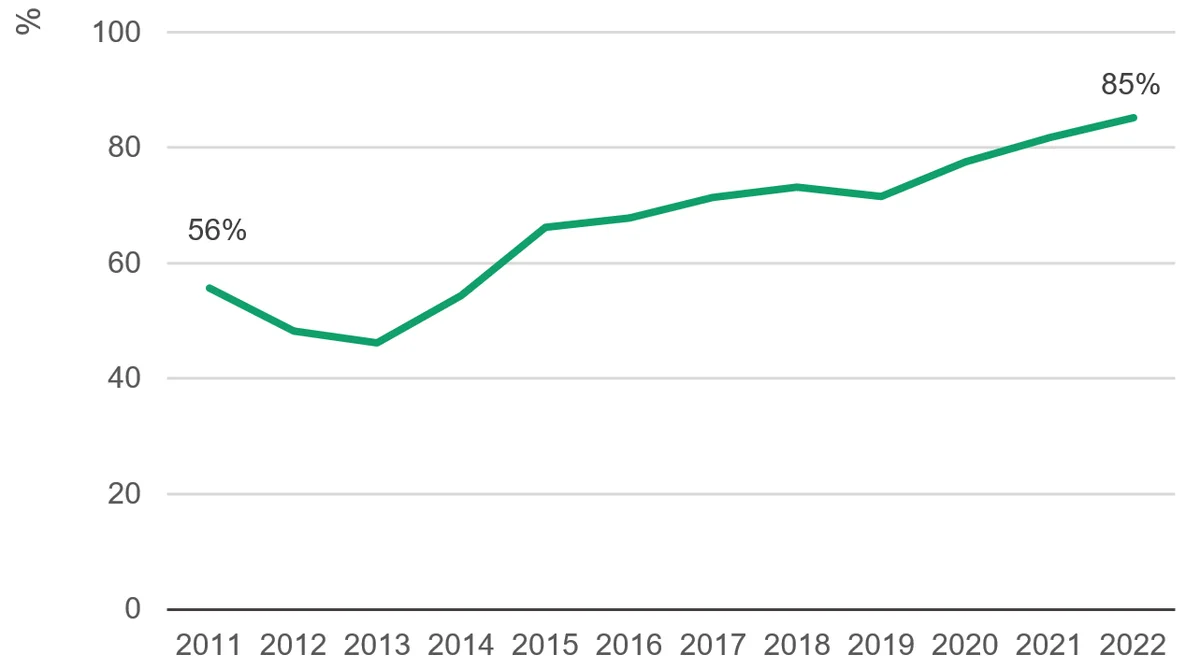
For example, in previous analysis we considered one provider (the UK’s Foreign & Commonwealth Development Office – FCDO), training a model on its 2022 data. We found the accuracy [8] of the model’s predictions steadily decreases going back in time, as would be expected if the provider had begun to report a much wider range of projects as climate finance. In 2022, 85% [9] of projects identified as climate finance by the model were tagged as such by FCDO, however in 2011 the figure was only 56% (Figure 3.3), indicating that based on the approach to reporting in 2022, nearly double the projects in 2011 should have been labelled as climate finance.
Taking these changes into account, the increase since in FCDO’s climate finance since 2016 [10] would have been 7%, just one-fifth of an increase of 34% according to the official figures. [11]
Figure 3.3: Analysis using machine learning suggests FCDO climate reporting has changed such that increases are overstated
Percentage of projects classed as climate by machine-learning model that were actually classed as such by FCDO (based on 2022 data)
placeholder
Source: DI analysis of International Aid Transparency Initiative data.
Note. The UK's Department for International Development (DFID) closed in 2020, merging with the Foreign & Commonwealth Office to create the Foreign, Commonwealth & Development Office (FCDO).
► Read more from DI on missing baselines . We used a natural language processing model and backcast the results to find out if increases in climate finance since 2009 be due to changes in reporting practices.
Inconsistency across climate finance data sets: The evidence
One issue that has made analysis of climate finance difficult is that information from different sources is hard to reconcile. There are two main datasets on bilateral climate finance: data submitted to the UNFCCC as part of Biennial Reports; and the OECD Creditor Reporting System (CRS), which contains data on development finance flows and the Rio markers. Each has substantial limitations. Being able to connect the two datasets would allow users to overcome some of these, but although they cover largely the same activities, this is often not possible.
The data provided to the UNFCCC is viewed as being the most official source of climate finance reporting, as reporting on such flows is mandated as part of the Paris Agreement. [12] However, there are numerous well-reported [13] issues with this data: countries report a mix of disbursements and commitments; detailed information is scant, including the agency responsible or terms on loans; and descriptions are often inadequate to assess whether the project has a genuine climate focus. There is also no project documentation provided, meaning it is not always clear what impact on climate change the project is intended to have, or how this would be measured. For projects for which commitments are recorded, there is no way of determining eventual disbursements.
These problems mean this data is rarely used in analysis, despite its more ‘official’ nature. Instead, the majority of analyses of publicly provided bilateral climate finance use the OECD CRS dataset and identify climate finance using the Rio markers. However, this dataset also has limitations. The most significant is that some countries do not use the Rio markers as the basis of their climate finance reporting to the UNFCCC, and for these countries, the CRS does not provide the share of projects counted as climate finance. In addition, the coverage of non-ODA flows is incomplete, for example, Japan reported other official flows towards climate of US$1.3 billion to the UNFCCC in 2020, but these are not reported in the CRS.
In principle, it should be possible to combine the two datasets as both are based on the same projects. The rich information contained in the CRS – including project numbers that facilitate tracking down project documents – would help evaluate the relevance of projects reported to UNFCCC.
However, in practice, there are significant challenges in pairing the two datasets, and for some countries, the differences between the two make it unfeasible. Often this relates to the timing of commitments, which are not counted in the CRS until there is a “firm written obligation”, [14] whereas there are no such restrictions in reporting to the UNFCCC. This means projects generally appear much later in the CRS data. For example, the German project “Energy Efficiency Program India II” is listed as a 2019 project in UNFCCC data (BR5), but only appears in the CRS in 2022, and even then for a fraction of the amount. [15] Another difference is how projects are aggregated – this often happens to a higher level in UNFCCC data (for example, the largest German ‘project’ reported to the UNFCCC for 2020 was "Grant equivalent for development loans of KfW – mitigation", whereas in the CRS the loans are listed separately). [16] Also project titles are occasionally different between the datasets.
For at least one climate finance provider, the application of Rio markers is determined by an entirely different team to that responsible for submitting UNFCCC data. In this case, projects reported to UNFCCC will only be findable in the CRS if both teams agreed entirely on which projects to count, and given the degree of subjectivity involved, this is unlikely to be the case.
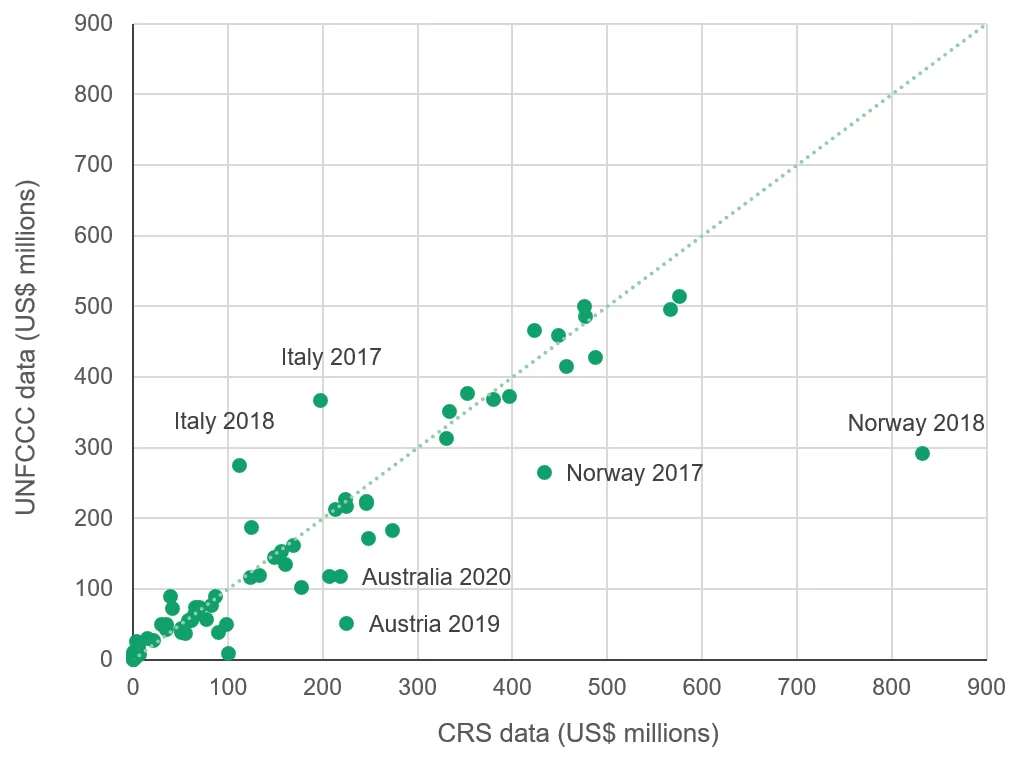
Consequently, naively plotting countries’ climate finance as reported to the UNFCCC against that reported to the CRS for the same year (applying the coefficients on the significant marker and making other adjustments) yields some large disparities (Figure 3.4). This is something that the OECD had endeavoured to change, promoting harmonisation efforts between the two reporting mechanisms. For the time being, however, climate finance according to the two databases is often inconsistent within providers, not just across them.
Figure 3.4: Data from OECD and UNFCCC datasets shows different pictures
Scatter plot of bilateral climate finance by year/country pairs, according to UNFCCC data, and Rio marker methodologies used by countries
placeholder
Source: Development Initiatives’ analysis of OECD CRS data, various OECD surveys on the use of Rio markers, and UNFCCC Biennial Reports 3 and 4.
Notes: Every effort has been made to ensure comparability. For CRS data, project values have been transformed according to the methodology contained within the OECD Rio marker surveys. The coefficients on the significant marker have been applied, only countries that report only commitments or disbursements are included, all adjustments based on other purpose codes or markers reported as part of the Rio marker survey are made, and only countries using the markers as the basis of submission are included.
How climate-relevant is funding? Using new assessment tools
To fully understand why a provider has decided to count a project as climate finance (and evaluate this reasoning) it is often necessary to examine not only the project description, but also the project documentation. Given the sheer volume of projects that are counted as climate finance, it is not feasible to analyse them manually. Recent advances in machine learning models used to analyse text data have presented new options for scrutinising this element of climate finance. The ability of machine learning models to identify patterns in text means that they can, with sufficient data for training, be used to classify projects (so long as they have adequately detailed descriptions), or identify projects that do not fit within common reporting patterns as in a recent DI blog. [17]
► Read more from DI on using machine learning to asses climate finance . We considered how the World Bank and the UK are recording climate funds, and our model identified one in five of the Bank's projects as appearing suspicious and warranting further investigation, compared with the UK's one in 50.
Comparing providers against a common benchmark
These models can also give an indication of the level of consistency between providers. A model trained on a sample of projects that have been manually classified according to their climate focus can be used as a common benchmark against which to judge countries’ reporting. The model can be used on each providers’ own data to predict the climate focus of their projects. Then, because all the predictions are based on the same manually curated data, if one country’s actual climate-marking is in line with the prediction from the model, but another’s deviates substantially, then it suggests that these countries are not classifying projects as climate-focused in a consistent way.
One study attempted to do this (published by Toetzke et al in 2022). [18] The authors selected a sample of 1,500 projects from the CRS and manually classified these according to their climate focus. [19] They then trained a natural language processing model on this curated dataset to identify the links between patterns contained within the project descriptions and their classification. With this model, the authors predicted the climate-focus of the rest of the projects in the CRS dataset. Comparing the model’s predictions with the classifications assigned by donors provided a measure of the latter’s accuracy.
As the authors acknowledge, there are limitations to this approach. Most obviously, the method relies on project descriptions being of sufficient quality for the model to reach a conclusion, [20] and often, CRS project descriptions are not detailed enough to be informative (and are sometimes missing entirely). Furthermore, it may be that a project’s climate relevance is not obvious from the description in the CRS, but is demonstrated in project documentation. [21] Finally, as previously noted, some countries (such as the UK and the US) do not use Rio markers as the basis of their UNFCCC submissions, and so the accuracy of the markers does not necessarily have a direct impact on estimates of progress towards climate finance goals. Nevertheless, the method provides a useful sense check on the accuracy of donors’ marking.
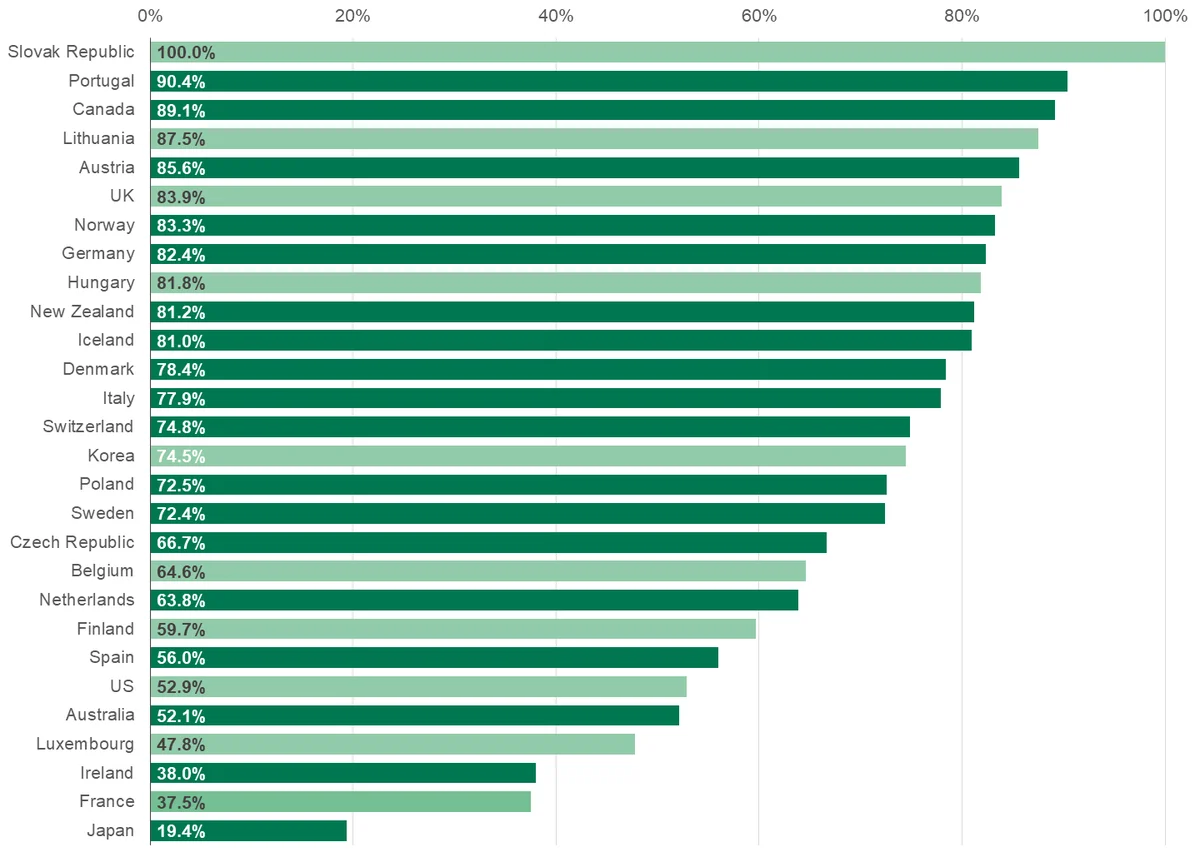
Figure 3.5: Wide range of quality in climate finance reporting, according to machine learning models
Share of principal-marked projects found to be climate related by Toetzke et al (2022)
placeholder
Source: Toetzke et al (2022)
Notes: ‘Precision’ is the proportion of projects that had a principal-marker applied that were also classified as climate finance according to ClimateBERT. Countries that use the Rio markers as the basis of UNFCCC submissions are coloured dark green.
Their results are concerning. On average, the ‘precision’ of the estimates (the share of principal-marked projects that the model also classified as climate finance) was around 68%. Climate objectives are supposed to be fundamental to the design of principal-marked projects, and yet, the model did not identify a climate link in nearly a third of ‘principle’ project descriptions.
This average hides considerable diversity: Portugal and Canada each had precision of around 90% (Slovakia had 100% precision but on a very small number of projects), whereas Japan had a precision of around 19%, and France and Ireland both had a precision of under 40%. The figures for France and Japan are particularly concerning, given that together they account for nearly half of bilateral climate finance between 2017 and 2020.
As well as suggesting that climate finance is severely overestimated – the authors find that spending on bilateral climate finance as identified by the model was 64% lower than combined spend on principal and significant-marked projects – these results also highlight the different practices among providers. By measuring countries against a common standard, Toetzke et al highlight the extent to which countries disagree with each other on what counts as climate finance.
The quantitative evidence in this chapter suggests a wide disparity in the quality of climate finance reporting. The next chapter draws on number of key informant interviews and reviews some of the reporting practices across a selection of providers, to better understand the drivers of these inconsistencies.
Notes
-
1
See, for example, the Center for Global Development’s 2020 blog post Coming Out in the Greenwash: How Much Does the Climate Mitigation Marker Tell Us? Available at: https://www.cgdev.org/blog/coming-out-greenwash-how-much-does-climate-mitigation-marker-tell-us .Return to source text
-
2
See, for example, an article by Romain Weikmans, J. Timmons Roberts, Jeffrey Baum, Maria Camila Bustos and Alexis Durand: 'Assessing the credibility of how climate adaptation aid projects are categorised’, Development in Practice, 27:4, 2017 (pp. 458–471). Available at https://www.tandfonline.com/doi/full/10.1080/09614524.2017.1307325Return to source text
-
3
This is the modal coefficient used among DAC providers.Return to source text
-
4
Sectors for which screening would be inappropriate have been excluded, such as in-donor refugee costs, administrative costs and general budget support. General budget support may end up supporting climate action but is excluded from the marking because it is, by definition, un-earmarked. It has declined slightly since 2009.Return to source text
-
5
Netherlands, CRS ID: 2010000209.Return to source text