Domestic financial flows in Kenya before and during Covid-19
This briefing tracks domestic revenue and spending to key pro-poor sectors in Kenya before and during the Covid-19 pandemic.
DownloadsExecutive summary
This paper tracks public revenue and spending in Kenya across two periods: before Covid-19 (2016/17–2018/19) and during Covid-19 (2019/20–2021/22). It provides an overview of the context of Covid-19 in Kenya before outlining the Government of Kenya’s financial and fiscal response to the pandemic – including the resources mobilised between financial year (FY)2016/17 and FY2020/21, allocations to key sectors before and during Covid-19, and public debt and debt servicing.
Key findings
- Although growth was interrupted in FY2020/21, total revenue has been on an upward trend since FY2016/17. The recent decline was caused by Covid-19 shocks that disrupted economic activities and necessitated tax relief measures to protect people and businesses from the effects of the pandemic. Growth is expected to rebound by 8.7% in FY2021/22.
- While the national budget increased steadily in the pre-Covid period (except in 2017/2018), it dipped slightly during Covid-19. It decreased by 0.3%, from KES 2.8 trillion (US$ 26 billion) in FY2019/20 to KES 2.790 trillion in FY2020/21. In FY2021/22, the tabled budget will increase by 7.9% to KES 3.01 trillion driven by increased revenue collection which is estimated to be KES 2 trillion.
- Six out of twelve sectors of the Kenyan economy had cuts in FY2020/21. In FY2021/22, further cuts are found in only two sectors. The cuts in FY2020/21 aimed to decrease sectoral expenditure given the reduced revenue collection, so that the freed funds could be used for other sectors vital to the Covid-19 recovery. The cuts in FY2021/22 will promote austerity measures aimed at cutting down on sector spending, especially spending that is not necessarily favouring the poor, beginning FY2021/22.
- Analysis of the allocations to pro-poor sectors [1] reveals a consistent improvement in budget allocations in four sectors during Covid-19. The social protection sector is an exception, with its allocations dropping slightly in FY2020/21.
- Almost one fifth of the national budget went towards debt servicing during Covid-19. This has reduced the country’s resources that could have otherwise been allocated to critical pro-poor sectors.
- Total public debt has been on the rise. Data from 2016 shows that public debt has been increasing by 16.7% on average annually. Significant growth of KES 0.8 billion was registered between June 2019 and June 2020, mainly driven by external debt. This was the highest growth in the last five years.
- One fifth of Kenya’s budget is allocated to interest payments on public debt. This is equivalent to 27% of the domestic resources mobilised on average between 2016 and 2020.
Recommendations
- Improve efforts to increase domestic revenue mobilisation and cut back on non-priority spending to avoid accruing more loans. These efforts should not come at the expense of the economy, which is just bouncing back from a challenging year. [2]
- In the short term, ensure that any austerity measures adopted to reduce Kenya's debt are designed to minimise the impact on the poorest by protecting spending on pro-poor sectors. This should balance the impact on pro-poor sectors and target non-essential welfare sectors.
- Renew focus on sectors relevant to the Covid-19 response. With the pandemic’s third wave arriving in Kenya, the national budget, including donor funds, should increasingly channel resources to sectors such as health, water, sanitation and hygiene (WASH), social protection and humanitarian sectors.
Covid-19 in Kenya
While the number of reported Covid-19 cases in Kenya was decreasing at the start of 2021, they increased in March when the second wave of Covid-19 hit the country. On average, Kenya reported 368 daily cases between 1–31 May 2021. The cumulative number of cases as of 31 May 2021 was 170,735, with 3,172 deaths and 116,847 recoveries. [3]
As of 31 May 2021, Kenya reported the highest Covid-19 cases, deaths and recoveries in East Africa: it had 77.5% of the reported cases, 89.2% of the deaths and 71.6% of the recoveries in the region as a whole. [4] Yet Kenya has made up a relatively small share of the 171.4 million Covid-19 cases worldwide. [5] As of 31 May 2021, it was responsible for 0.1% of cases, death and recoveries globally.
Even as the government rolls out its vaccination programme, the pandemic has disrupted several sectors of the economy. With a reported national poverty headcount rate of 36.1% in 2016, the pandemic has pushed more people further below the poverty line. [6] Individuals and businesses have been negatively impacted by job losses, reduced earnings in the public and private sectors, a shift to remote working and in the number of working hours, and widespread lockdowns and curfews. [7]
In response to the pandemic and the limited revenue collection during this period, the government has had to make budget cuts in some sectors while increasing spending in others. It has also had to introduce an economic stimulus package and waiver taxes to protect low-income earners and promote business continuity in the country. Furthermore, government borrowing has grown in order to enable increased expenditure in certain sectors considered critical to the Covid-19 response in Kenya. [8]
The country-level response to Covid-19
The Government of Kenya initiated policy and financial measures in response to Covid-19. It created the Economic Stimulus Package, a pool of funds designed to boost economic recovery and cushion vulnerable persons and businesses from the impact of Covid-19. The programme was allocated KES 56.6 billion across transport infrastructure, health, education, agriculture, tourism, water, sanitation and hygiene (WASH), manufacturing, and small and medium enterprises.
In a move to directly support people living in poverty, the government initiated a full waiver on income taxes to individuals who received less than KES 24,000 per month. Similarly, turnover taxes were reduced by 2% from the previous 3% for all micro, small and medium enterprises, while value-added tax was reduced by 2% from the previous 16%. [9] The government also reduced both income and corporation taxes by 5% from 30% to protect individuals and corporations against excessive taxes. [10]
The government created the Covid-19 Emergency Response Fund, which has collected KES 3.5 billion from private individuals and companies to mobilise additional financial and material support. Proceeds from the fund are used to provide medical supplies and personal protective equipment and to support vulnerable communities in urban and rural settlements during the pandemic. [11]
Some of the government’s policy and financial response to Covid-19 have elapsed. Tax cuts enacted in April 2020 to protect from the effects of Covid-19 ended on 30 December 2020, and the Economic Stimulus Package was only meant to last for FY2020/21. [12]
Domestic revenue
National revenue collected for budgeting purposes can be categorised into three different types:
- total revenue
- grants
- deficit financing.
Grants and deficit financing are mostly collected from donors to support infrastructural projects and other targeted programmes at both the national and county levels.
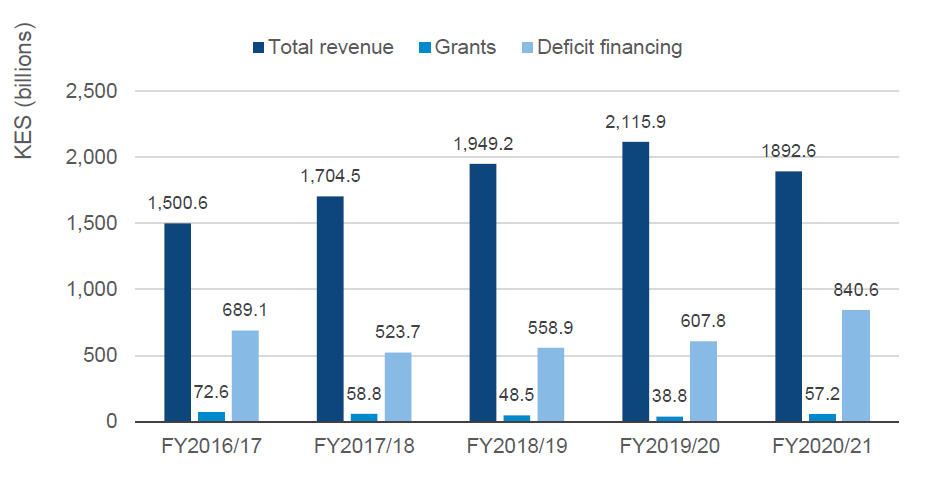
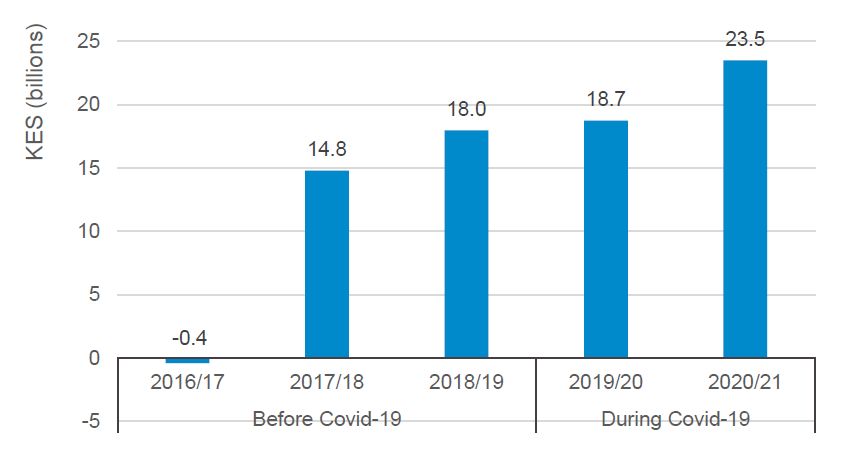
While there has been a significant year-on-year increase in total revenue (except in FY2020/21), the reverse is true for grants. Grants decreased annually between FY2016/17 and FY2019/20 before increasing in FY2020/21. Deficit financing decreased between FY2016/17 and FY2018/19 before increasing in both FY2019/20 and FY2020/21 (Figure 1).
Figure 1: Trends in revenue generated, FY2016/17–FY2020/21
Total revenue collected reduced in FY2020/21 due to Covid-19. Job losses and reduced earnings in both the private and public sector, and tax cuts in FY2020/21 intended to protect both the employed and unemployed [13] from the impact of Covid-19 contributed to the contracted revenue collected. [14] Tax groups that were affected include:
- Income tax, which reduced from 30% to 25%
- Value-added tax, which reduced from 16% to 14%
- Resident corporate income tax rate, which reduced from 30% to 25%
- Turnover tax rate for small and medium-sized enterprises (SMEs) from 3% to 1%. [15]
The decrease in the tax rates is top among the reasons for the sudden decrease in the total revenues collected for FY2020/21.
Conversely, there was a high percentage increase between FY2019/20 and FY2020/21 in deficit financing. This can be attributed to the high debt appetite of the Kenyan government, exacerbated by the need to protect Kenyans from the impact of Covid-19. Most of these funds considered as deficit financing went to either large infrastructural projects or were injected into programmes counteracting the negative impacts of Covid-19 on households and businesses. The funds also helped to strengthen the health infrastructure at the national and county levels.
The decrease in grant financing between FY2016/17 and FY2019/20 can be attributed to the prevailing grant funding trends from the donor community to East African countries. [16] Funding trend shows a decrease in grant funding in the period under review in EAC. However, in 2020/21, the entry of the Covid-19 in Kenya presented a multi-sectoral problem that necessitated an increase in the total grant funding to Kenya. Funds were included in programmes that bolstered the health infrastructure both at the county and national level, increased awareness around Covid-19 and provided the necessary cushion to vulnerable and distressed persons at the height of the pandemic outbreak.
The average revenue mobilised from domestic sources between FY2016 and FY2020 constitutes 15.8% of the country’s GDP. According to the recent economic performance released by the National Treasury, though the revenue growth has contracted in FY2020/21 – largely due to the negative effects of the pandemic on businesses and the tax incentives introduced to protect households and businesses from the economic impact of the pandemic – this growth is expected to rebound to 8.7% in FY2021/22. Total revenues in FY2021/22 are projected to increase to 15% of the country’s GDP from 14.4% in the previous financial year. At the same time, both deficit financing and grant funding are likely to increase in the next FY, with the effects of Covid-19 beginning to slow down but not ending yet. [17]
Domestic public financial flows
Covid-19 negatively impacted revenue collection in FY2020/21, which in turn affected the pool of resources available for funding in the FY2020/21 budget. However, revenue collection is expected to pick up in FY2021/22, underpinned by ongoing reforms in tax policy, revenue administration and the post-Covid economic recovery plan. [18]
While the national budget steadily increased before Covid-19 (except in FY2017/18), during Covid-19 the budget dipped slightly by 0.3% from KES 2.8 trillion in FY2019/20 to KES 2.790 trillion in FY2020/21. The budget for FY2021/22 is expected to increase by 7.9% to KES 3.01 trillion, supported by increased revenue collection which is estimated to be KES 2 trillion. [19] Sectoral budgetary changes in the form of cuts and increases, which have been implemented in FY2020/21, will be sustained in FY2021/22 to counter the impact of Covid-19. [20] Alongside these changes, cuts to sector spending that are not favouring the poor will be put in place to suppress the ballooning fiscal budget given the growing debt stock the country is finding itself in.
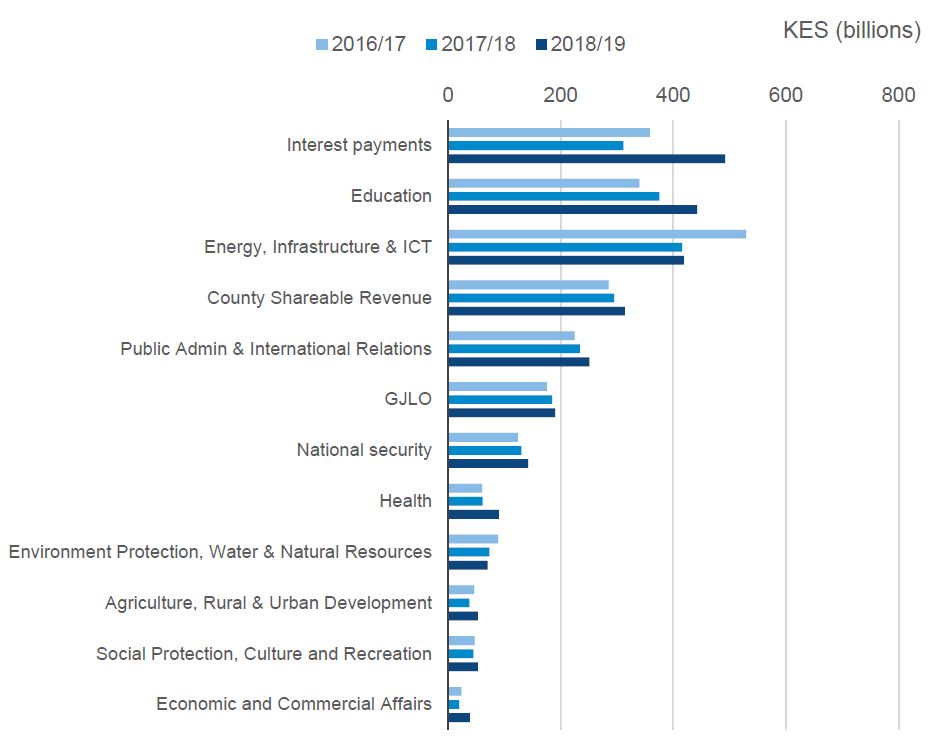
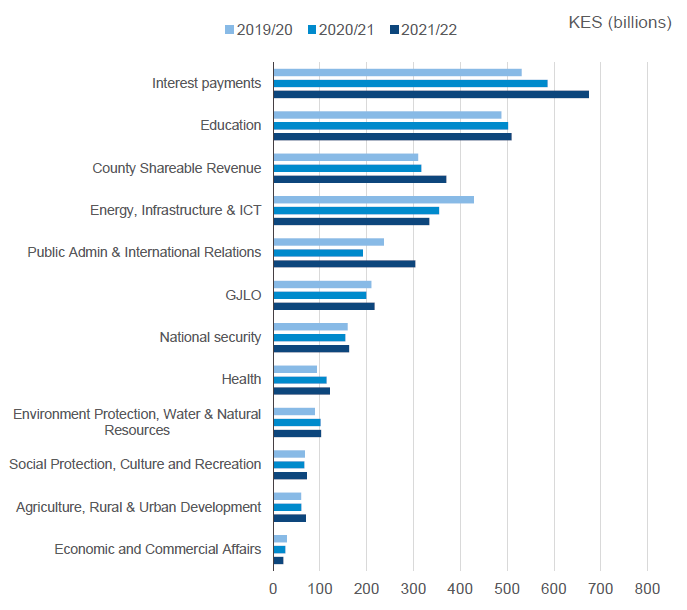
Comparing sectoral allocation before and during Covid-19 reveals interest payments as the most consistently financed sector for the three FYs during the pandemic (FY2019/20–FY2021/22). This was slightly different prior to Covid-19: while interest payments maintained the highest sectoral allocation in FY2018/19, it dropped to the third highest sectoral allocation in FY2017/18 and the second highest in FY2016/17. Given Kenya’s current debt stock, large interest payments will continue at least in the short term.
Apart from interest payments, the biggest beneficiary during Covid-19 has been the education sector (Figure 2b), followed by county shareable revenue and the energy, infrastructure and ICT sector. Comparing this to the situation before Covid-19 (FY2016/17–FY2018/19), the priority sectors were somewhat similar to those during Covid-19, with education, energy, infrastructure and ICT and county shareable revenue being in the top priority sectors (Figure 2a).
Figure 2a: Sector allocation before Covid-19
| Sector | 2018/19 | 2017/18 | 2016/17 |
|---|---|---|---|
| Economic and Commercial Affairs | 38.8 | 19.8 | 23.6 |
| Social Protection, Culture and Recreation | 52.9 | 45.2 | 47.4 |
| Agriculture, Rural & Urban Development | 53 | 38 | 46.5 |
| Environment Protection, Water & Natural Resources | 70.3 | 73.5 | 89 |
| Health | 90.0 | 61.6 | 60.3 |
| National security | 142.3 | 130.2 | 124 |
| GJLO | 190.2 | 184.8 | 175.4 |
| Public Admin & International Relations | 251 | 234.1 | 224.9 |
| County Shareable Revenue | 314 | 295 | 284.8 |
| Energy, Infrastructure & ICT | 418.8 | 415.7 | 529.1 |
| Education | 442.3 | 375.3 | 339.9 |
| Interest payments | 491.927 | 311.58 | 358.18 |
Source: Development Initiatives based on The National Treasury of Kenya.
Note: GJLO = governance, justice, law and order.
Figure 2b: Sector allocation during Covid-19
| Sector | 2021/22 | 2020/21 | 2019/20 |
|---|---|---|---|
| Economic and Commercial Affairs | 21.5 | 26.1 | 29.3 |
| Agriculture, Rural & Urban Development | 69.7 | 60.2 | 59.6 |
| Social Protection, Culture and Recreation | 72 | 66.4 | 67.5 |
| Environment Protection, Water & Natural Resources | 102.6 | 101.6 | 88.9 |
| Health | 121.1 | 114 | 93.3 |
| National security | 162.3 | 154.5 | 159.3 |
| GJLO | 216.5 | 199.3 | 209.8 |
| Public Admin & International Relations | 303.8 | 191.5 | 236.6 |
| Energy, Infrastructure & ICT | 333.7 | 354.6 | 428.8 |
| County Shareable Revenue | 370 | 316.5 | 310 |
| Education | 509.2 | 501.7 | 487.5 |
| Interest payments | 674.229 | 586.468 | 530.793 |
Source: Development Initiatives based on The National Treasury of Kenya.
Note: GJLO = governance, justice, law and order.
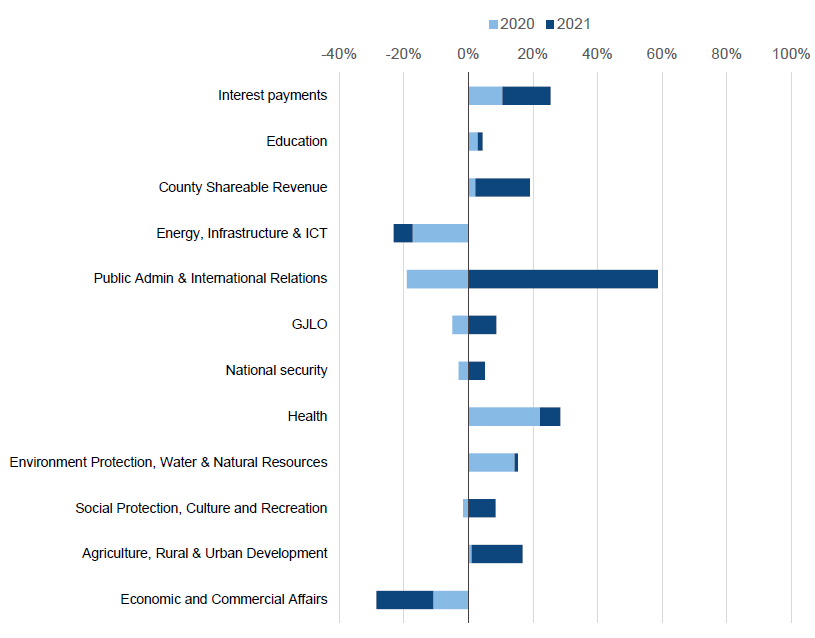
While FY2020/21 presented cuts in six out of the twelve sectors, FY2021/22 indicates cuts in only two sectors. Cuts in FY2020/21 aimed to decrease sectoral expenditure given the reduced revenue collection in FY2020/21. [21] Some of the freed funds were diverted to other Covid-sensitive sectors to allow sectoral programme expansion in order to counteract the impact of Covid-19.
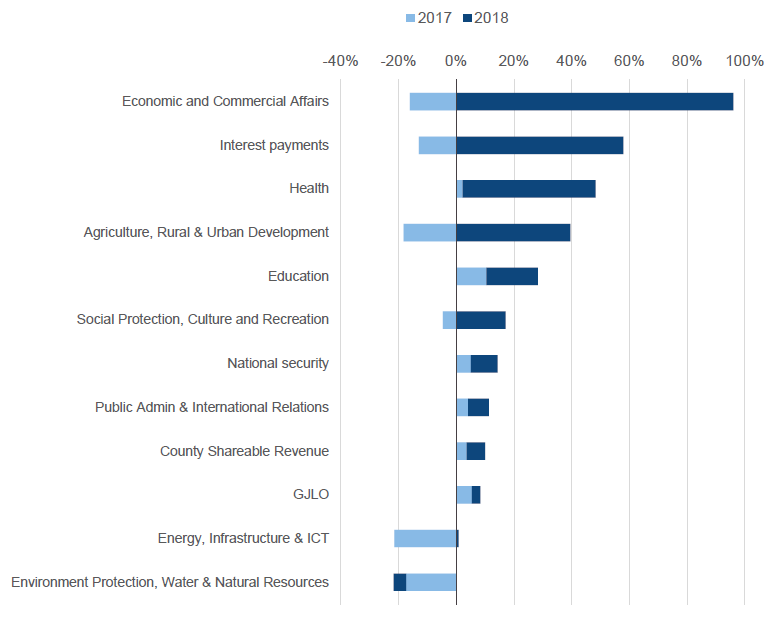
Cuts in FY2021/22 mainly aimed to promote cut backs on sectoral spending that are not necessarily favouring the poor given the country’s current debt stock. [22] There were cuts in six out of the twelve sectors in FY2017/18 and in just one in FY2018/19 – environment protection, water and natural resources. The budget reduction before Covid-19 aimed to cut down non-essential expenditure items and streamline the public service sector.
Sectors that received a boost in allocation during the Covid period were complemented by the economic stimulus package introduced in FY2020/21 and the increased revenue collection expected in FY2021/22. Notably, changes in sectoral allocations during Covid-19 reveal that sectors that are naturally linked to the pandemic (health, education, WASH, agriculture, and social protection) benefitted from a consistent increase in allocation in three FYs, with the exception of social protection which had a 1.1% allocation decrease between FY2019/20 and FY2020/21 (Figure 3b). Comparing allocations to these specific sectors before and during Covid-19 reveals allocations increased consistently in only two sectors, health and education, declining at least in one FY in the remaining sectors (Figure 3a).
Figure 3a: Funding allocation change across sectors before Covid-19 (FY2016/17–FY2017/18 and FY2017/18–FY 2018/19)
| Sector | 2017 | 2018 |
|---|---|---|
| Environment Protection, Water & Natural Resources | -17.4% | -4.4% |
| Energy, Infrastructure & ICT | -21.4% | 0.7% |
| GJLO | 5.4% | 2.9% |
| County Shareable Revenue | 3.6% | 6.4% |
| Public Admin & International Relations | 4.1% | 7.2% |
| National security | 5.0% | 9.3% |
| Social Protection, Culture and Recreation | -4.6% | 17.0% |
| Education | 10.4% | 17.9% |
| Agriculture, Rural & Urban Development | -18.3% | 39.5% |
| Health | 2.2% | 46.1% |
| Interest payments | -13.0% | 57.9% |
| Economic and Commercial Affairs | -16.1% | 96.0% |
Source: Development Initiatives based on The National Treasury of Kenya.
Note: GJLO = governance, justice, law and order.
Figure 3b: Funding allocation change across sectors during Covid-19 (FY2019/20–FY2020/21 and FY2020/21–FY2021/22)
| Sector | 2020 | 2021 |
|---|---|---|
| Economic and Commercial Affairs | -10.9% | -17.6% |
| Agriculture, Rural & Urban Development | 1.0% | 15.8% |
| Social Protection, Culture and Recreation | -1.6% | 8.4% |
| Environment Protection, Water & Natural Resources | 14.3% | 1.0% |
| Health | 22.2% | 6.2% |
| National security | -3.0% | 5.0% |
| GJLO | -5.0% | 8.6% |
| Public Admin & International Relations | -19.1% | 58.6% |
| Energy, Infrastructure & ICT | -17.3% | -5.9% |
| County Shareable Revenue | 2.1% | 16.9% |
| Education | 2.9% | 1.5% |
| Interest payments | 10.5% | 15.0% |
Source: Development Initiatives based on The National Treasury of Kenya.
Note: GJLO = governance, justice, law and order.
Allocations to pro-poor sectors
A review of both programme-based budgets and sector budget proposals shows not only the trends in allocation but also the funding gaps in the pro-poor sectors. Due to lack of data on sector budget proposals in FY2021/22, the analysis is limited to the period between FY2016/17 and FY2020/21. Additionally, it will only pick subsectors that directly benefit the poor, except the health sector which has been picked as whole. These subsectors include:
- Water and sanitation
- Basic education
- Social protection
- Agriculture (crop development and livestock)
- Health and social protection.
The funding in some sectors prioritised programmes countering the impact of the pandemic and supporting people living in poverty as well as vulnerable and marginalised persons in Kenya. Allocations were aimed to bolster the livelihood of communities during Covid-19 through the provision of employment opportunities, safety net programmes, clean water and affordable health and a conducive learning environment for school-age children.
An analysis of the allocations to pro-poor sectors reveals that there was consistent improvement in budget allocations during Covid-19 in four sectors, with the exception of the social protection sector, whose allocations dropped in FY 2020/21. Allocations before Covid-19 show inconsistencies in budget appropriations – especially to WASH and agriculture sectors, whose allocations dropped by 22% in FY 2017/18. While there has been an improvement in the volume of allocation consistently in three subsectors, especially during Covid-19, this increase masks the funding gaps in these sectors, which will be discussed in the next section.
Pro-poor sector financing trends
To examine how the pandemic has altered the financing gap (the difference between sector requirements and allocations), this section examines key sectors that are of direct relevance to Covid-19: health, education, WASH, social protection and agriculture. As a result of Covid-19, there is an increasingly widening funding gap in two of these five pro-poor sectors: basic education and social protection.
Though the funding gaps in the health, agriculture and WASH sectors reduced during Covid-19, they remain significant. While the average funding gap in the five pro-poor sectors before Covid-19 was KES 22.6 million, it increased by 62.4% during Covid-19, to KES 36.7 million. This underscores the increased needs of people living in poverty during Covid-19 and the reduced sectoral funding resulting from a contraction in revenues in FY2019/20 and FY2020/21.
Health
The health sector budget allocation has increased consistently both before and during Covid-19. While the volume of allocation between FY2016/17 and FY2020/21 has increased, this masks the funding gap between sector requirements and budget allocation. Moreover, the sector has a heavy reliance on donor funding, which may not be sustainable in the long term as most donors have been scaling down their funding in the recent past, which could affect operations of sectoral programmes in the short term. [23]
Comparing allocations before and during Covid-19 shows that before Covid-19, sector allocations increased by 2% between FY2016/17 and FY2017/18 and 46% between FY2017/18 and FY2018/19. Allocations during Covid-19 increased 22.2% between FY2019/20 and FY2020/21 and 6.2% between FY2020/21 and FY2021/22.
Health sector funding requirements have increased consistently between FY2016/17 and FY2020/21. Between FY2016/17 and FY2018/19, the funding requirement increased by 62.3% to KES 115 billion driven by the launch of universal health care in FY2018/19. During Covid-19, though the sector funding requirement increased, the improvement was surprisingly meagre (7.9%) given the health sector’s needs due to the pandemic.
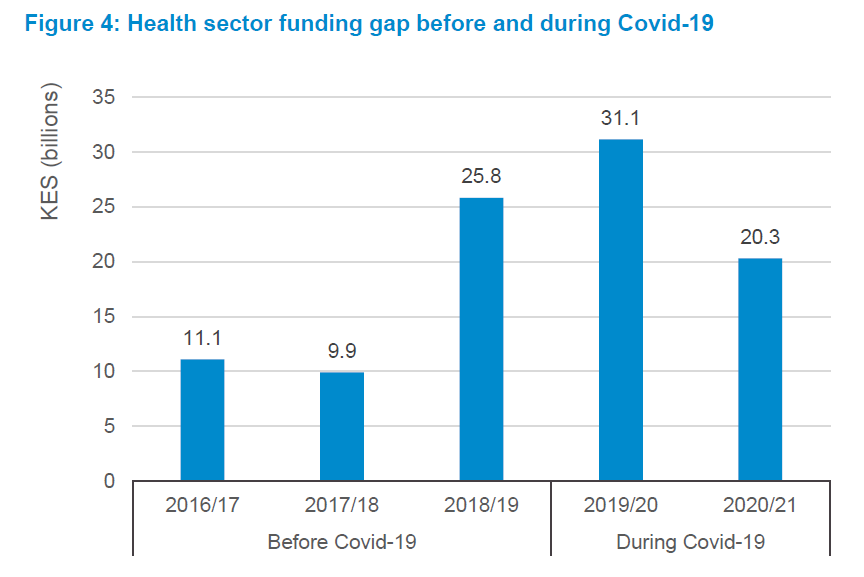
The funding gap before Covid-19 was erratic, declining slightly from KES 11.1 billion in FY2016/17 to KES 9.9 billion in FY2017/18 before increasing to 25.8 billion in FY2018/19. During Covid-19 the funding gap increased in FY2019/20 from KES 25.8 billion in the previous year to KES 31.1 billion, before dropping to KES 20.3 billion in FY2020/21. The drop in FY2020/21 could be explained by increased need in the health sector with the entry of Covid-19 (Figure 4).
Figure 4: Health sector funding gap before and during Covid-19
Agriculture
Agriculture is one of the few sectors that has been benefiting from increased allocation during Covid-19. We consider only two sub-sectors under the agriculture, rural and urban development sector: crop development and livestock subsectors that are directly linked to the people living in poverty. Allocation to these two subsectors prioritised programmes facilitating food security and increasing productivity and output.
Allocations both before and during Covid-19 were inconsistent and characterised by significant changes in budget appropriations. Budget considerations before Covid-19 decreased by 22.3% in FY2017/18 and increased by 10% in FY2018/19. Allocations during Covid-19 initially dropped in FY2019/20 by 4.4% before making a 59.3% jump in FY2020/21. This increase will be sustained by a margin of 12.1% in FY2021/22, mainly driven by allocations to the crop development programme.
The average percentage share of agricultural budget in the total budget both before and during Covid-19 was dismal – despite how central agriculture is to the Kenyan economy. Before Covid-19, agriculture made up, on average, 1.3% of the budget. This increased by 0.2% during Covid-19, bringing the average to 1.5%.
The sector’s funding requirements were inconsistent in the pre-Covid period, increasing by 48.3% between FY2016/17 and 2017/18 before declining 8.6% between FY2017/18 and 2018/19. The funding requirements however increased by 5.7% between FY2019/20 and FY2020/21 to KES 61.5 billion in FY2020/21.
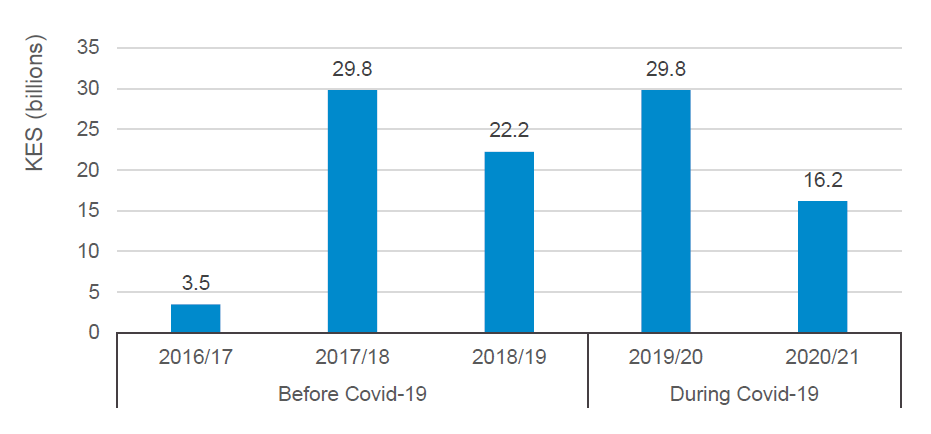
Prior to Covid-19, funding gaps increased consistently between FY2016/17 and FY2018/19, from KES 3.5 billion to KES 22 billion. Similarly, during Covid-19, funding gaps increased 34.2% to KES 29.8 billion in FY 2019/20, down from KES 22.2 billion in the previous FY; however the gap dropped to KES 16.2 billion in FY 2020/21 supported by increased funding in the crop development programme (Figure 5). According to sector reports, the funding gaps are associated with inadequate funding due to competing priorities, delays in disbursements of the exchequer and the slow enactment of new legislation in the two subsectors.
Figure 5: Agriculture sector funding gap before and during Covid-19
Basic education
Basic education includes early childhood, primary and secondary education. Subsector allocations before Covid-19 shows a 47.5% increase between FY2016/17 and FY2018/19. This increase was driven predominantly by increased allocation to secondary education from KES 34.9 billion in FY2016/17 to KES 69.3 billion on FY2018/19 as a result of the full transition from primary to secondary schools. Allocations during Covid-19 decreased marginally in FY2019/20 by 0.1% and further reduced by 0.6% in the following FY. However, allocations are expected to increase by 5.5% in FY2021/22.
While the average percentage of basic education’s share of the total budget before Covid-19 was 3.6%, it decreased slightly during Covid-19 to 3.3%.
Similar to the health sector, the funding requirements in the basic education subsector have increased consistently across the periods discussed in this paper. The sector funding requirements increased from KES 62.4 billion in FY2016/17 to KES 141 billion in FY2018/19. During Covid-19, the funding requirement further increased by 6.5% to KES 161.4 billion in FY2020/21.
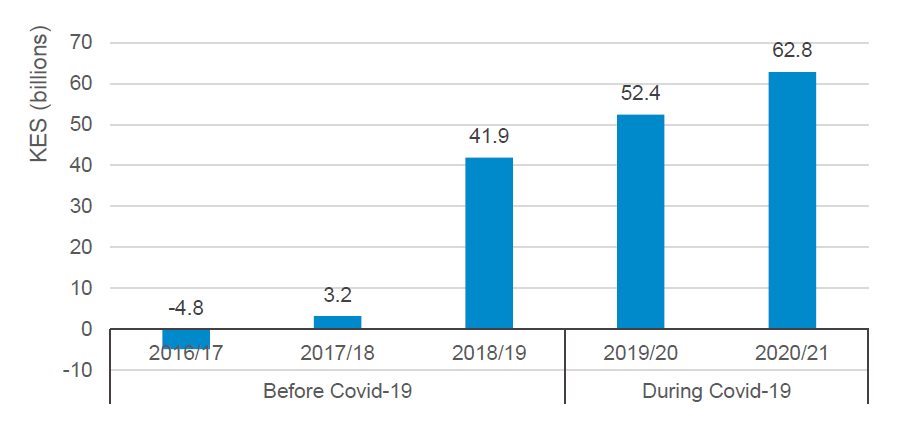
The study shows that the basic education subsector funding gap is not only widening but is also the highest of all the pro-poor sector in one of the five financial years reviewed – KES 62.8 million in FY 2020/21 (Figure 6). The funding gap averaged KES 13.4 billion before Covid-19. However, it widened to KES 57.6 billion during Covid-19. Like the rest of the pro-poor sector, the sector reports acknowledge inadequate funding and delays in disbursement of the exchequer as the main reason for the substantial sectoral funding gaps.
Figure 6: Basic education sector funding gap before and during Covid-19
Social protection
During Covid-19, the social protection subsector prioritised allocation to two sub-programmes: Social Development and Children Services and the National Social Safety Net.
Budget allocation during Covid-19 initially increased from KES 31.3 billion in FY2018/19 to KES 33.4 billion in FY2019/20 before dropping 2.4% in FY2020/2. Allocations will increase by a similar margin (2.7%) in FY2021/22. These are low numbers compared to before Covid-19, when allocations increased by 5.7% in FY2017/18 and 29.3% between FY2018/19 and FY2017/18.
Average share percentage in the total budget in the six financial years reviewed was 1.2%, peaking at 1.24% in FY2020/21.
The sector’s funding requirements were the least of all the pro-poor sectors in all the five FYs reviewed. Requirements constantly increased with each preceding financial year, more than doubling (118.7%) before Covid-19 and increasing 7.7% during Covid-19 to KES 56.2 billion in FY2020/21.
Analysis shows that while the funding gap before Covid-19 averaged KES 10.8 billion, this increased to KES 21.1 million during Covid-19 underpinned by the increased needs of people living in poverty during the pandemic (Figure 7). This widening funding gap could have a negative impact on programmes meant to benefit people living in poverty and marginalised communities, especially now that Covid-19 has affected the economy.
Figure 7: Social protection sector funding gap before and during Covid-19
Water and sanitation
Allocations to this subsector aim to promote water resource and sewerage management, irrigation and land reclamation. Allocations before Covid-19 initially dropped by 21.8% in FY2017/18 but rebounded 56.5% to KES 52.9 million in FY2018/19. On the other hand, budget allocation during Covid-19 increased by 15.4% in FY2019/20 and 24.5% in FY2020/21. This will be sustained in FY2021/22 as allocation will increase to KES 78 million.
The sector’s funding requirements were erratic in the period under review. Requirements doubled between FY2016/17 and FY2017/18 increasing 100.3%, and decreased 14.3% between 2017/18 and 2018/19. Similar to the financial years before Covid-19, sector requirements decreased by 17.2% between FY2019/20 and FY2020/21.
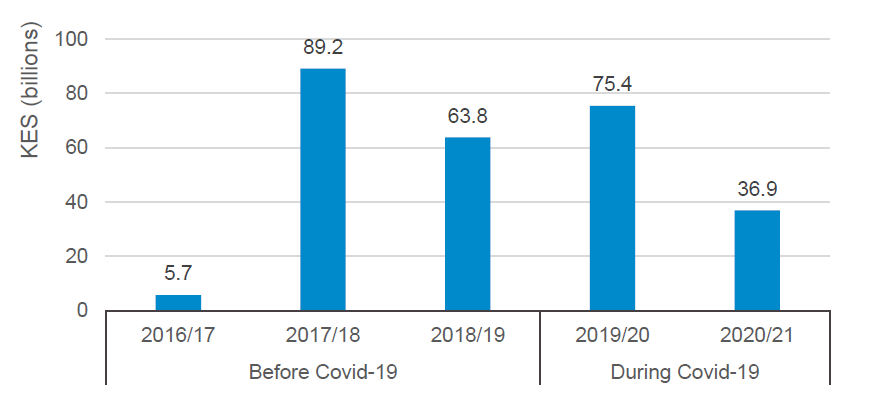
This being one of the Covid-related sectors, we examined budget requirements and allocation where we found that the pre-pandemic financial gap on average was KES 52.9 billion in the three financial years preceding Covid-19. The sector’s funding gaps were the highest of all the pro-poor sector in three FYs: FY2017/18 (KES 89.2 billion), FY2018/19 (KES 63.8 billion) and FY2019/20 (KES 75.4 billion). Average funding gap during Covid increased to KES 56.2 billion driven by a KES 75.4 billion funding gap in FY2019/20 (Figure 8).
According to the sector reports, the funding gaps in this sector are caused by inadequate funding on the backdrop of increasing population, hence increasing need. Additionally, poor management of water and sanitation resources available and over-exploitation of the ecosystem requiring huge funding for conservation are driving the funding requirements higher, increasing the funding gap.
Figure 8: Water and sanitation sector funding gap before and during Covid-19
Debt and debt servicing
The causes of Kenya’s existing debt include a high debt appetite, substantial infrastructural capital requirements and high budget deficits. Most recently, Kenya has sought out loans to offset the negative impacts of Covid-19 on the economy. While the country’s public debt stock continues to grow, debt repayment is also rising, limiting the resources for service delivery to citizens at both the national and county levels. To offset the growing debt burden, the government is reducing its spending budget in non-priority sectors, merging government agencies that have interlinking functions, and curbing expenditure by suspending non-essential, expensive and large-scale infrastructure projects. However, the government should be cautious and avoid diverting expenditure from key sectors such as health, social protection, education and WASH – all of which are critical in containing the spread and impact of Covid-19.
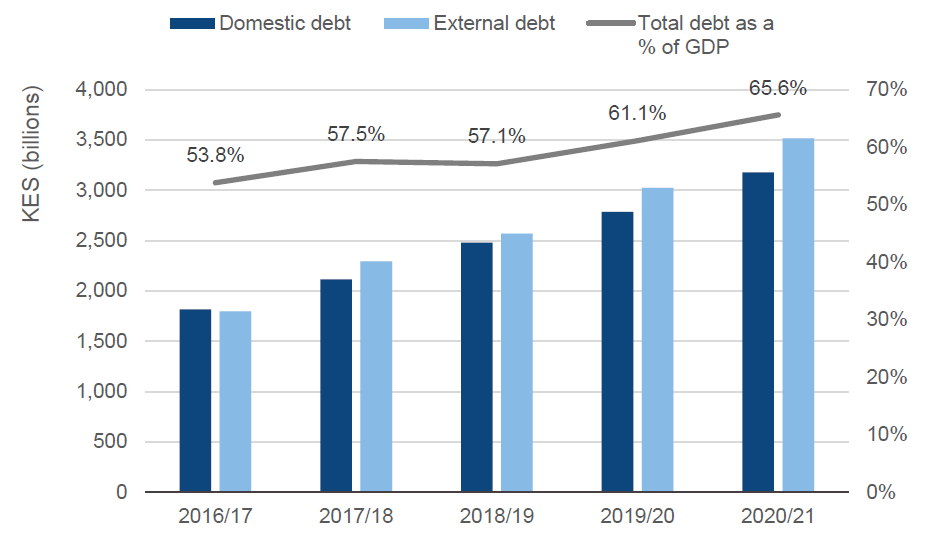
Total public debt – external and domestic – has been on the rise, increasing 16.7% on average annually over the last five years. Compared to the recommended debt-to-GDP ratio by the International Monetary Fund (IMF) on developing countries, public debt stock had reached KES 6.7 trillion, equivalent to 65.6% of GDP, by the end of June 2020, with a slightly higher external debt than domestic debt (Figure 9).
Figure 9: Trends in public debt and total debt as a percentage of GDP, FY2016/17–FY2019/20
| Jun-16 | Jun-17 | Jun-18 | Jun-19 | Jun-20 | |
|---|---|---|---|---|---|
| Domestic debt | 1,815,133 | 2,112,710 | 2,478,835 | 2,785,483 | 3,177,526 |
| External debt | 1,796,198 | 2,294,153 | 2,568,399 | 3,023,139 | 3,515,812 |
| Total debt as a % of GDP | 53.8% | 57.5% | 57.1% | 61.1% | 65.6% |
Source: Development Initiatives based on Annual Public Debt Management Reports, The National Treasury of Kenya.
The structure of public debt as of June 2020 reveals that while commercial and multilateral debts have significantly changed between 2010 and 2020, bilateral debt has largely remained the same. Between 2010 and 2020, multilateral loans decreased from 66% to 38% while both bilateral and commercial debts improved. Bilateral debt increased slightly from 30% to 31% while commercial loans increased from 4% to 31%, raising the cost of debt servicing.
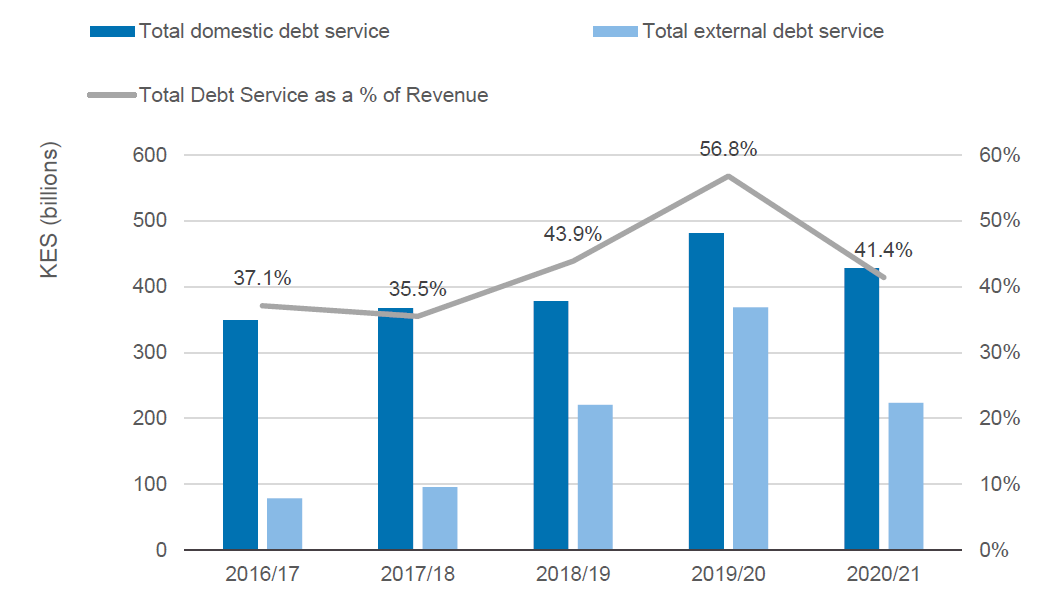
According to the National Treasury of Kenya, in the last five FYs, Kenya has serviced its domestic debts more than its external debts. On average, it has spent KES 400.8 billion on domestic debts and KES 197.4 billion on external debts. In total, the government’s debt service payments have averaged KES 598.17 billion in the last five years, capping at KES 850 billion in June 2019. Kenya has been increasing its debt service consecutively between FY2016/17 and FY2019/20. Debt service temporarily dropped in 2020/21 due to reduced revenue collection and huge sectoral requirements presented by the pandemic. Debt service increased by 8.3% in FY2017/18, followed by a 29.2% increase in 2018/19 and finally a 42% growth in 2019/20. It then dropped by 23.4% in FY2020/21. The increase in FY2019/20 could be attributed to maturity of huge volumes of debts in FY2019/20 (Figure 10).
Kenya’s public debt is slowly but steadily rising to unsustainable tipping point. In FY2020/21 Kenya has serviced its debt at a cost of KES 651 billion which is higher than any sectoral allocation in FY2020/21. Similar to FY2020/21, Kenya’s debt service in FY2019/20 exceeded the highest sectoral allocation by KES 355.2 billion. Moreover, we found above, on average, 20% of Kenya's annual budget is allocated for interest payment, which is 26.9% of what the country managed to mobilise domestically on average across the years reviewed. This means more than a quarter of the country’s revenue collected for budgeting goes to servicing the country’s debt rather budgeting on critical sectors, especially in the wake of Covid-19.
Figure 10: Trends in debt service payments, FY2016/17–FY2020/21
| 2016 -Jun | 2017-Jun | 2018-Jun | 2019-Jun | 2020-Jun | |
|---|---|---|---|---|---|
| Total domestic debt service | 349,010 | 367,587 | 377,870 | 481,593 | 428,033 |
| Total external debt service | 78,583 | 95,623 | 220,638 | 368,478 | 223,440 |
| Total Debt Service as a % of Revenue | 37.1% | 35.5% | 43.9% | 56.8% | 41.4% |
Source: Development Initiatives based on Annual Public Debt Management Reports, The National Treasury of Kenya.
Comparing debt service in the last two financial years (FY2019/20 and FY2020/21) reveals both years had highest debt service as a percentage of revenue. However, FY2020/21 had reduced percentages, which can be attributed to reduced revenue collection and restricted import and export movement due to Covid-19. Should the country maintain its debt service trajectory, the percentage of debt service to the revenue is likely to hit between 55% and 60% given the amount debt stock and debt maturities in the coming FY. This means over half of the country’s total revenue collected will fund its debt service payments. Similar scenarios are likely to play out for external debt service as a percentage of exports.
Implications of the changes in debt service
Kenya has been servicing its debts at an average of KES 598.17 billion in the last five years. This is higher than any sectoral allocations in the last five years. Debt service decreased by 23.4% in 2020/21; however, this is expected to increase by almost a third of the total debt service payment in 2020/21 given the amount of debt stock and maturity period. This could present challenges to the country’s budget and deficit financing. Deficit financing will increase as well as cuts in the various sectors to allow for debt servicing. Moving forward, the government should strengthen revenue collection structures especially at the county level to avoid the recurring debt cycle.
Conclusion and recommendations
Kenya is faced with the challenge of increasing its revenue mobilisation and supporting people living in poverty from the impacts of Covid-19 while simultaneously ensuring economic growth. The country will have to increase its revenue and cut back on expenditure on non-priority sectors to counter the increasing debt stock growth. Though the International Monetary Fund (IMF) projects Kenya to grow at rate of 7.6%, this will likely be accompanied by an increase in debt stock from both domestic and external sources.
Donor financing, which Kenya has heavily relied on, is increasingly leaning towards loans. Given the national debt situation, this arrangement is unsustainable in both the short and long terms. Caution must be taken to avoid large loan accruals; instead, there should be a focus on grant aid and domestic resource mobilisation.
Kenya faces obstacles ahead, with the third wave of Covid-19 emerging in late March 2021. A sustained increase in funding for critical sectors – such as health, WASH and social protection – will be required in the years to come.
Recommendations
Recommended actions for the Kenyan government include:
- Improve efforts to increase domestic revenue mobilisation and cut back on non-priority spending to avoid accruing more loans. These efforts should not come at the expense of the economy, which is just bouncing back from a challenging year. [24]
- In the short term, ensure that any austerity measures adopted to reduce Kenya's debt are designed to minimise the impact on the poorest by protecting spending on pro-poor sectors. This should balance the impact on pro-poor sectors and target non-essential welfare sectors.
- Renew focus on sectors relevant to the Covid-19 response. With the pandemic’s third wave arriving in Kenya, the national budget, including donor funds, should increasingly channel resources to sectors such as health, WASH, social protection and humanitarian sectors.
Downloads
Notes
-
1
Pro-poor sectors are those sectors that directly target the poor with sector funding meant to reduce poverty.Return to source text
-
2
International Monetary Fund, 18 March 2021. IMF to support economic recovery in Kenya. Available at: www.imf.org/en/News/Articles/2021/03/17/na031721-imf-loan-to-support-economic-recovery-in-kenyaReturn to source text
-
3
Ministry of Health, www.health.go.ke/ (accessed 9 June 2021)Return to source text
-
4
As of 31 May 2021, East Africa has recorded 220,220 cases, 3,557 deaths and 163,180 recoveries.Return to source text
-
5
World Health Organization. World Covid-19 cases as of 31 May 2021, https://covid19.who.int/table (accessed 13 May 2021)Return to source text
Related content
Tracking the global humanitarian response to Covid-19
An overview of the humanitarian response to Covid-19, showing general humanitarian funding trends as well as the quality of funding and reporting
Kenya’s Covid-19 budget: Funding for health and welfare
How the new budget will support Kenya's health and welfare systems as they deal with the impact of Covid-19 (coronavirus) and scale up universal health coverage
Socioeconomic impacts of Covid-19 in Kenya
How has coronavirus impacted housing, transport, food security and the labour force in Kenya? This paper looks at government measures initiated in these areas.
