ODA (aid) spending in 2018
DI presents analysis of the final ODA (aid) data for 2018. Our factsheet shows how much was given and in what form, as well as a breakdown of recipient countries and sectors, and the share of aid going to projects focused on climate or gender.
DownloadsIntroduction
This factsheet presents analysis of the OECD DAC’s release of final official development assistance (ODA) data for 2018. It shows how much was given and in what form, as well as a breakdown of recipient countries and sectors, and whether donor countries disbursed funds to projects focused on climate or gender. ODA spending data is released the year after the spending occurs, making the 2018 release the latest figures available.
In September 2019 heads of state and government and other high representatives met in New York to review progress on the implementation of Agenda 2030. It was the first UN Sustainable Development Goal (SDG) Summit since the SDGs were adopted in 2015. Emphasising that “eradicating poverty in all its forms and dimensions, including extreme poverty, is the greatest global challenge and an indispensable requirement for sustainable development” [1] and recognising the need “to do more and faster”, [2] they called for a ‘Decade of Action’ to deliver on the SDGs by the established 2030 deadline.
This presents a unique opportunity for providers of ODA to refocus their efforts and ensure that this vital resource is invested according to where it can have the greatest impact. The final ODA data for 2018 shows some encouraging shifts in allocation, although scope remains for donors to reassess their portfolios and be sure that they are effectively addressing the needs of the most vulnerable people and places through a balanced and context-specific mix of instruments and sectors. [3]
Key facts
- Overall ODA volumes continue to fall, from US$149 billion in 2017 to US$147 billion in 2018; however, excluding in-donor refugee costs, they show a marginal increase (Figure 1).
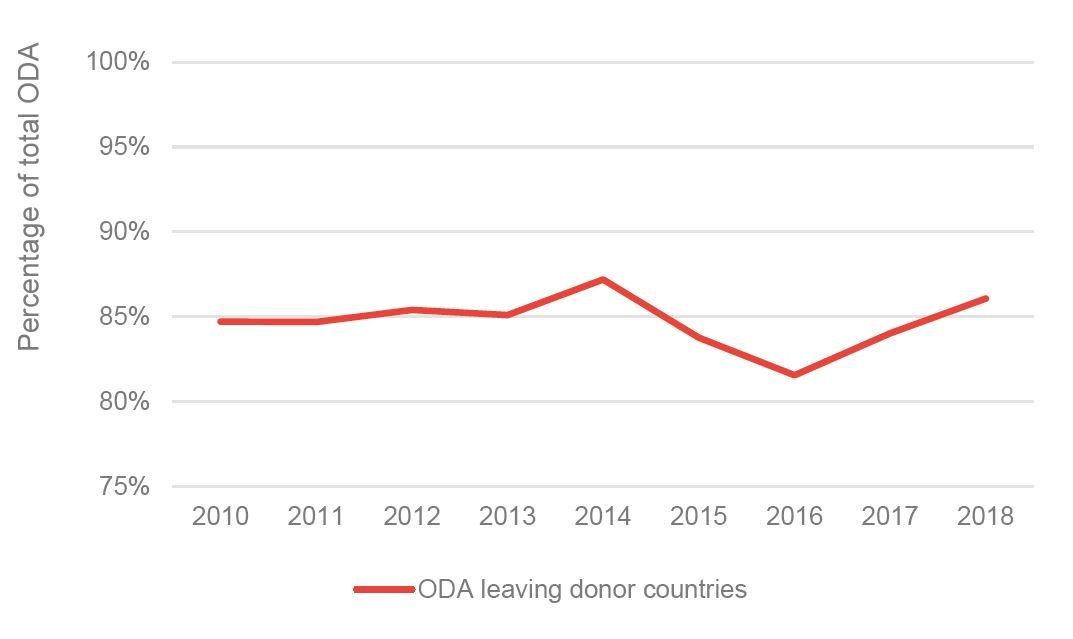
- The 2018 data confirms the continuing trend of more ODA leaving donor countries, which started in 2017. In 2018 the figure stands at 86% (Figure 2).
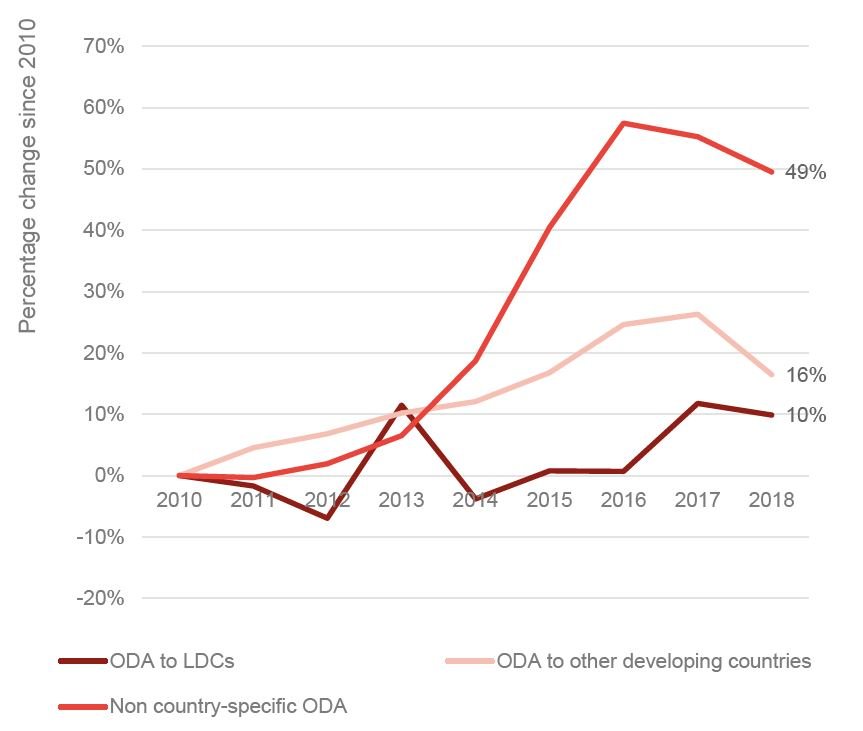
- For the first time since 2010, ODA to non-LDCs decreased; however, compared to 2010 levels, ODA to non-LDCs is still growing faster than ODA to LDCs (Figure 3).
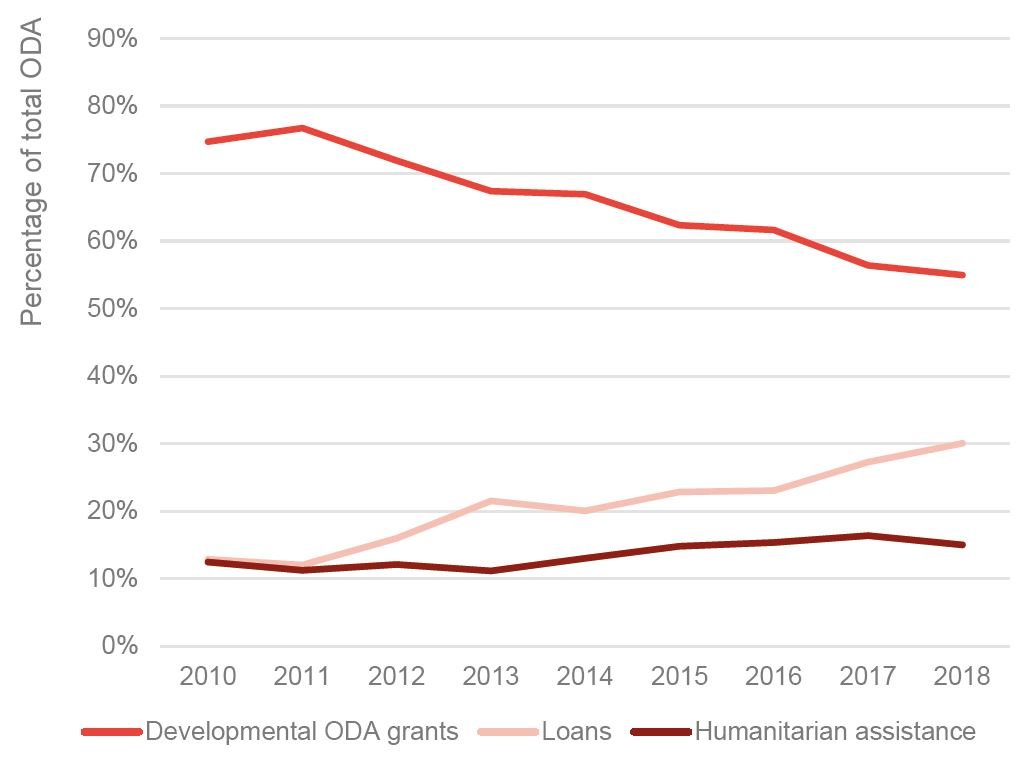
- Much of the (relatively slower) growth in ODA to vulnerable countries such as LDCs has been driven by increases in bilateral and multilateral loans: these rose from 13% of total ODA to LDCs in 2010, to 30% in 2018. Long-term developmental grants have decreased in share from 75% to 55% over the same period (Figure 4).
- ODA spending to sectors key for strengthening human capital – health, education and social protection – is decreasing as a share of total ODA (Figure 7).
Overall volumes
Figure 1: Headline volumes continue to fall, though excluding in-donor refugee costs they show a marginal increase since 2016
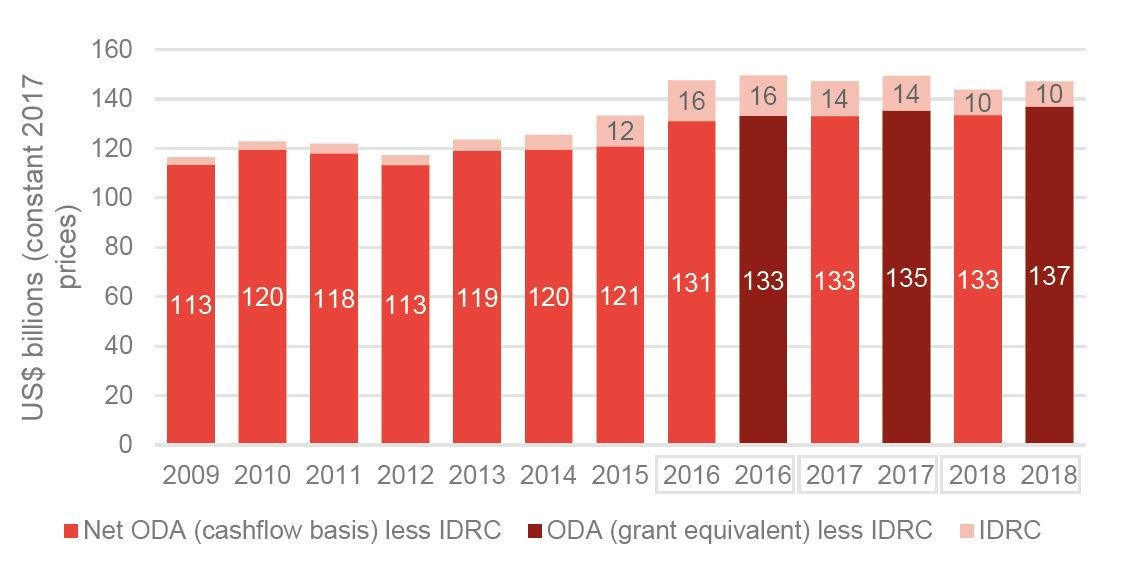
Headline volumes continue to fall, though excluding in-donor refugee costs they show a marginal increase since 2016
Source: Development Initiatives based on OECD DAC data. Note: IDRC = in-donor refugee costs.
- Final data confirms DI’s April 2019 preliminary finding that in 2018, ODA volumes fell for the second consecutive year. Net ODA fell by US$3.4 billion, or 2.3%. Under the new grant equivalent measure ODA fell by US$2.2 billion, or 1.5%. This was largely due to a reduction in in-donor refugee costs (IDRCs) which had inflated aid figures in previous years.
- Excluding IDRCs, aid has increased marginally between 2017 and 2018 with net ODA up by US$421 million, or 0.3%, and, according to the new grant-equivalent measure, rising by US$1.6 billion, or 1.2%. [4]
- As shown in Table 1, increases in ODA volumes reported by several (mostly small) donors – totalling US$2.7 billion – were not enough to counter the substantive decreases reported by other DAC members (many of them large donors), which amounted to US$6.3 billion.
- Additionally, most donors continue to fall short of the long-standing 0.7% gross national income (GNI) target. In 2018 this was met by only the same five donors that met it in 2017 (Denmark, Luxembourg, Norway, Sweden and the UK).
Volumes by donor
Table 1: Several large donors reported significant falls in net ODA
| Donor |
Net ODA 2018
(US$m) |
Net ODA 2017
(US$m) |
US$ difference | % difference | % difference (excl. IDRCs) |
|---|---|---|---|---|---|
| Australia | 3,149 | 3,004 | 145 | 4.8% | 4.8% |
| Austria | 1,167 | 1,332 | -164 | -12.3% | -5.4% |
| Belgium | 2,348 | 2,337 | 11 | 0.5% | 5.1% |
| Canada | 4,641 | 4,396 | 244 | 5.6% | 5.5% |
|
Czech
Republic |
305 | 333 | -28 | -8.4% | -9.4% |
| Denmark | 2,577 | 2,567 | 9 | 0.4% | 2.7% |
| Finland | 984 | 1,151 | -167 | -14.5% | -13.3% |
| France | 12,840 | 11,975 | 865 | 7.2% | 6.4% |
| Germany | 25,670 | 26,675 | -1,005 | -3.8% | 7.8% |
| Greece | 290 | 330 | -40 | -12.0% | 1.6% |
| Hungary | 285 | 158 | 127 | 80.6% | 82.4% |
| Iceland | 74 | 69 | 5 | 7.8% | 35.6% |
| Ireland | 934 | 879 | 55 | 6.3% | 5.0% |
| Italy | 5,098 | 6,223 | -1,124 | -18.1% | -7.7% |
| Japan | 10,064 | 11,627 | -1,563 | -13.4% | -13.4% |
| Korea | 2,420 | 2,278 | 142 | 6.3% | 6.2% |
| Luxembourg | 473 | 456 | 17 | 3.8% | 3.8% |
| Netherlands | 5,617 | 5,308 | 308 | 5.8% | 14.2% |
| New Zealand | 556 | 443 | 113 | 25.6% | 26.7% |
| Norway | 4,258 | 4,444 | -186 | -4.2% | -2.9% |
| Poland | 759 | 715 | 44 | 6.2% | 6.2% |
| Portugal | 388 | 404 | -16 | -4.1% | -5.0% |
|
Slovak
Republic |
138 | 128 | 10 | 7.8% | 8.4% |
| Slovenia | 84 | 81 | 3 | 3.1% | 1.3% |
| Spain | 2,540 | 2,705 | -166 | -6.1% | -8.6% |
| Sweden | 5,847 | 5,593 | 254 | 4.5% | 11.8% |
| Switzerland | 3,097 | 3,190 | -93 | -2.9% | -1.4% |
|
United
Kingdom |
19,462 | 19,111 | 351 | 1.8% | 2.0% |
|
United
States |
33,787 | 35,512 | -1,725 | -4.9% | -5.5% |
| Total DAC | 149,852 | 153,425 | -3,573 | -2.3% | 0.4% |
Source: Development Initiatives, based OECD DAC data. Notes: Data in constant 2018 prices. IDRC = in-donor refugee costs.
- Using the net ODA measure, ODA rose in 17 DAC members and fell in 12 – however, the largest percentage rises were among smaller donors.
- The largest falls, in cash terms, were reported by four members of the G7 − the US (US$1.7 billion), Japan (US$1.6 billion), Italy (US$1.1 billion) and Germany (US$1.0 billion).
- German ODA excluding IDRCs actually rose by almost 8%, in contrast to the 3.8% drop in German net ODA when IDRCs are included.
ODA leaving donor countries
- In 2018, 86% of ODA was transferred from donor countries. This percentage grew for the second year in succession mainly due to the reduction in IDRCs reported by donors.
- US$24 billion, or 14%, of reported gross ODA was not transferred to developing countries, or international initiatives, but was spent within the donor country.
- The largest single factor in non-transfer ODA was IDRCs (US$10.8 billion), but administrative costs (US$9.0 billion) and in-donor costs of students (US$3.7 billion) were also significant.
ODA to LDCs
- Total aid to least developed countries (LDCs), from DAC donors and multilateral organisations combined, fell by more than US$800 million to US$49.2 billion in 2018.
- ODA to non-LDCs also fell, by US$5.5 billion.
- Compared to 2010 levels, growth in ODA to non-LDCs continues to outpace that given to LDCs. In 2010, aid to non-LDC countries was 16% higher than in 2010, while ODA to LDCs rose by 10% over the same period.
- Over the same period, aid with no specified recipient countries rose fastest of all and (despite decreasing by almost US$2 billion in 2018) is 49% higher than the 2010 level.
Grants and loans
- The proportion of ODA to LDCs in the form of loans more than doubled between 2010 and 2018, and now accounts for over 30% of ODA to LDCs (compared to 13% in 2010).
- Humanitarian assistance to LDCs has also been rising as a share of total LDC ODA, though at a slower rate: it rose from 12% in 2010 to 16% in 2017 before dropping back to 15% in 2018.
- Conversely, the share of ODA reaching LDCs in the form of long-term developmental grants has been decreasing, from 75% of total LDC ODA in 2010 to 55% in 2018.
A focus on gender
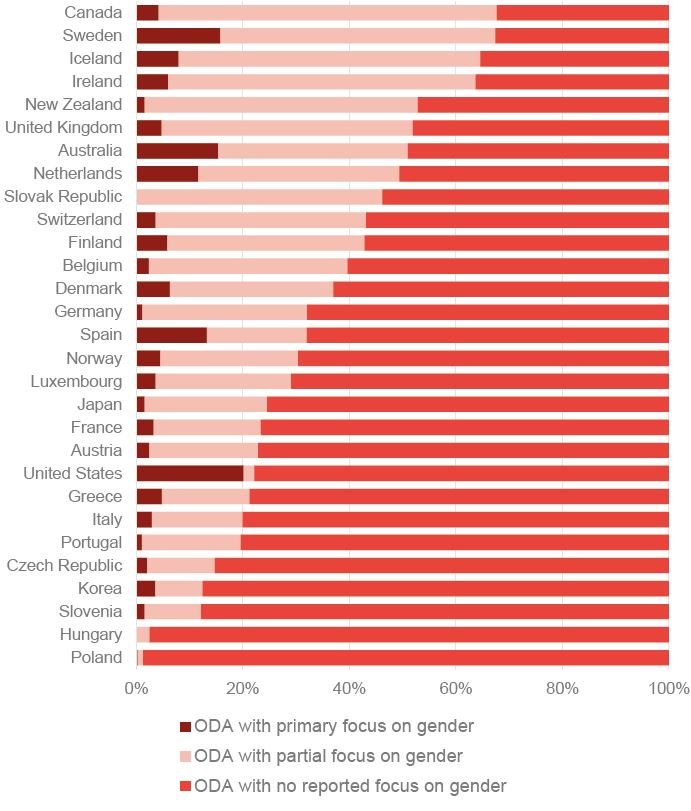
- In 2018, only 8% of DAC donors’ bilateral ODA went to projects with a primary focus on gender. A further 25% went to projects with a partial focus on gender.
- There is a wide disparity between donors – some large donors such as Japan and Germany gave less than 2% of their aid to projects with a primary focus on gender, while the US, Sweden, Australia, Spain and the Netherlands gave over 10% of aid to such projects. The share of US ODA with a primary focus on gender quadrupled between 2017 and 2018, from US$1.5 billion in 2017 to U$6 billion in 2018.
A focus on climate change
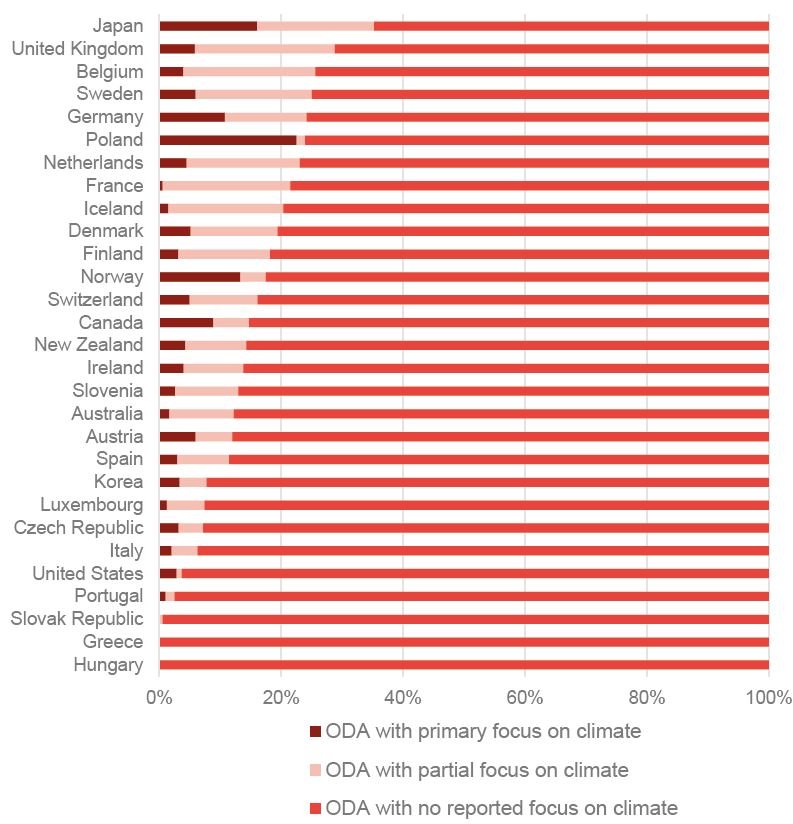
- Climate-related ODA has risen 28% since 2015, compared to ODA growth of 7% overall. It accounted for 18% of all ODA in 2018.
- In 2018, 7% of DAC bilateral ODA went to projects for which climate mitigation or climate adaptation was the primary policy objective. A further 12% went to projects that had different key policy objectives but incorporated climate concerns (i.e. projects with a partial climate focus). [5]
- ODA spent on projects with either a principal or partial focus on climate totalled US$21.1 billion. About half (51%) of this total went to mitigation activities, 28% to adaptation activities, and 20% to activities addressing both adaptation and mitigation issues.
Breakdown by sector
Figure 7: The infrastructure and banking sectors are receiving an increasing share of total ODA, while the proportions going to human capital sectors are decreasing
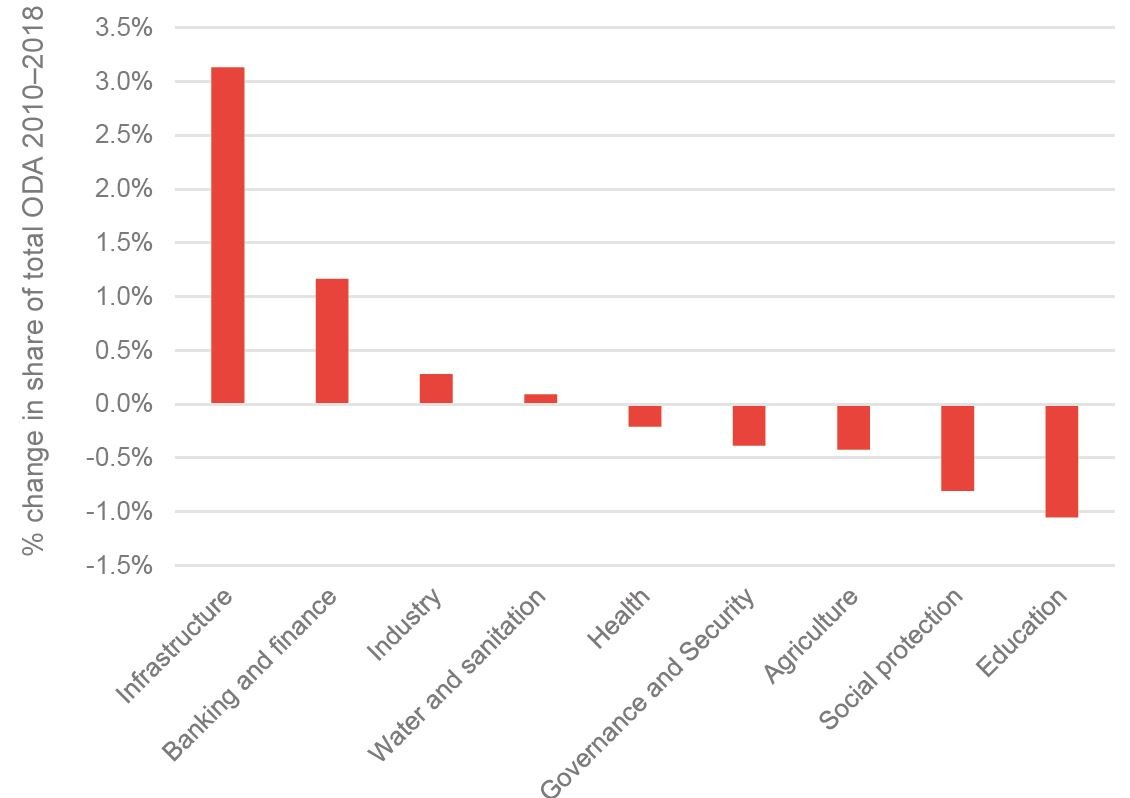
The infrastructure and banking sectors are receiving an increasing share of total ODA, while the proportions going to human capital sectors are decreasing
Source: Development Initiatives, based OECD DAC data.
- Human capital sectors (health, education and social protection) are seeing decreases in the share of ODA allocations compared to 2010 levels. ODA to health fell for the first time since 2014. ODA to education as a share of total ODA (while still lower than 2010 level), saw a marginal resurgence in 2018, increasing by US$300 million (or by 0.5% as a share of total ODA over 2017 levels).
- Infrastructure as a share of total ODA has increased the most, from US$19.5 billion in 2010 (14% of total ODA) to US$28.8 billion in 2018 (17% of total ODA).
- Overall, in 2018, economic infrastructure and productive sectors accounted for 30% of total country-allocable ODA, compared to 44% going to social infrastructure and services. [6]
Private sector instruments
Figure 8: ODA disbursed through private sector instruments totalled US$2.9 billion
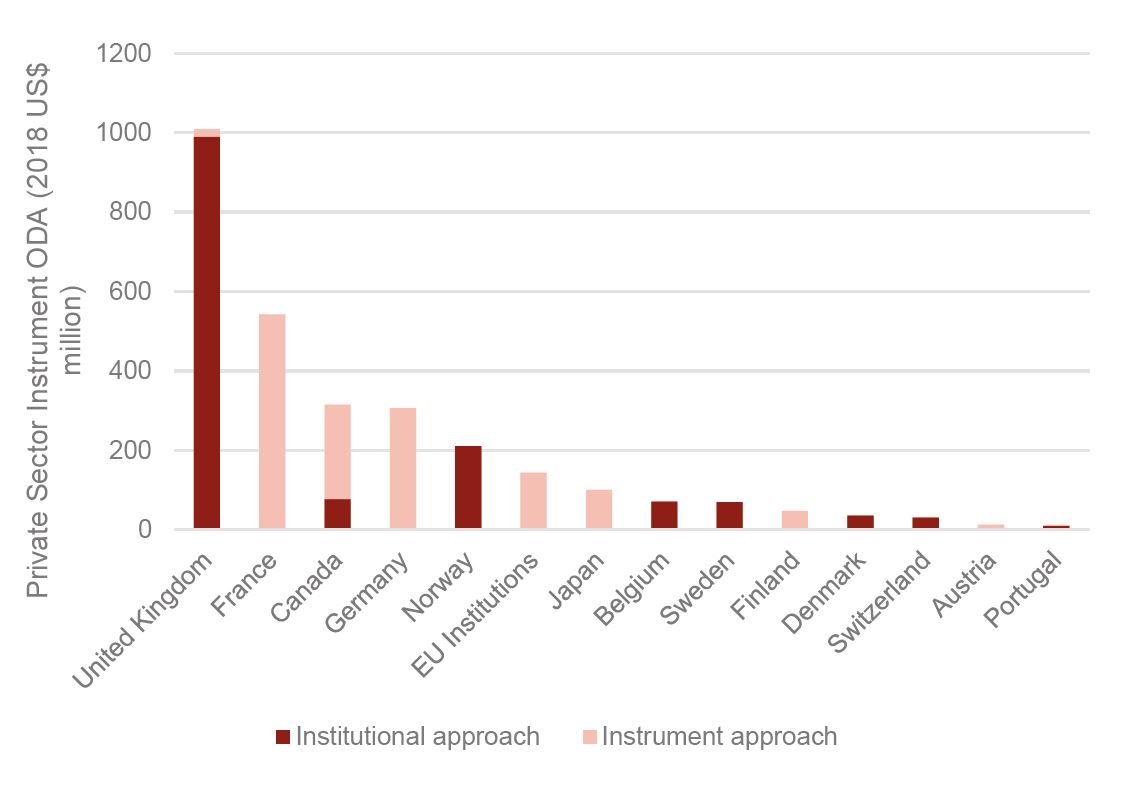
ODA disbursed through private sector instruments totalled US$2.9 billion
Source: Development Initiatives, based OECD DAC data. Note: The institutional approach measures the ODA-eligible share of inflows to development finance institutions (DFIs) and the instrument approach measures the grant equivalent total of individual private sector instrument flows to partner countries. Data is in constant 2018 prices.
- Donors reporting the highest volumes of private sector investments (PSIs) are the UK, France and Canada – with PSI ODA accounting for 5.2%, 4.5% and 6.8% of their total ODA respectively.
- While not substantial, these allocations are expected to increase given the continued momentum in the blended finance market and increasing pressure on donors to support the mobilisation of additional resources for development from the private sector. [7]
- Currently just over half of PSI ODA is being reported according to the institutional approach (US$1.5 billion of the US$2.9 billion reported as total PSI ODA in 2018), meaning that activity-level detail on half of PSI investments is unavailable.
- Unless robust reporting standards for PSIs are agreed, any increase in this use of ODA risks jeopardising both transparency and accountability on the use of scarce concessional public resources, with repercussions on the effectiveness of allocation decision-making too.
Downloads
Notes
-
1
Paragraph 3 https://undocs.org/en/A/RES/74/4Return to source text
-
2
Paragraph 27 https://undocs.org/en/A/RES/74/4Return to source text
-
3
Forthcoming work by Development Initiatives will address the question of ODA allocation across instruments and approaches in more detail and provide a framework to guide donor decision-making in this respect, with the view of ensuring that the progress of the poorest people remains at the core of donor portfolios.Return to source text
-
4
The difference between the old and new measures is to be attributed to the way that ODA loans are accounted for; under the old measure the full face value of the loan is reported with loan repayments subtracted, while under the new measure only the grant equivalent of the loan is reported (and loan repayments are not subtracted).Return to source text
-
5
ODA relevant to climate change is identified using the OECD DAC’s Rio markers. Reporters can mark a project as having either a significant or principal climate change adaptation or climate change mitigation policy objective, signalling the extent to which any project is relevant. Projects marked as ‘principal’ have adaptation or mitigation as a key objective, whereas projects marked as ‘significant’ have other key objectives and have been adjusted to incorporate climate concerns. There are some known limitations to the use of Rio markers, including but not limited to the coverage and consistency of their use in donors’ reporting to the DAC Creditor Reporting System. Not all donors screen each individual project against the markers, leaving gaps in coverage. The criteria for qualifying projects can also be subjective and interpreted differently. Despite these well-known limitations the Rio markers remain an important tool for indicating the amount of ODA relevant to climate objectives.Return to source text
Related content
Donors at the triple nexus
DI Senior Policy & Engagement Advisor Sarah Dalrymple presents some of our recent analysis into how donors like Sweden and the UK are approaching the triple nexus between humanitarian, development and peace approaches in crisis contexts.
Implications of coronavirus on financing for sustainable development
DI Executive Director Harpinder Collacott summarises the possible impacts of the coronavirus pandemic on global development - including projections for extreme poverty, the future of different forms of financing, and the countries likely to be most impacted.
What do emerging trends in development finance mean for crisis actors?
DI's webinar ‘What do emerging trends in development finance mean for crisis actors?’ gives crisis actors key information on development finance to better understand what it means for them.
