Global Humanitarian Assistance Report 2020: Chapter 2
International humanitarian assistance
DownloadsIntroduction: International humanitarian assistance
The humanitarian landscape has been starkly altered by the advent of the Covid-19 (coronavirus) pandemic. The following analysis of key trends in international humanitarian assistance in 2019 highlights the foundation on which response to the pandemic is being built. It illustrates patterns in funding and issues with resourcing responses that will shape international humanitarian assistance in future, which will in turn be shaped by the broader economic and political impacts of the pandemic.
In 2019, international humanitarian assistance fell for the first time since 2012, with the majority of the largest donors reducing their contributions. However, humanitarian need continued to rise.
International humanitarian assistance from governments and private donors decreased to US$29.6 billion in 2019, down 5% from the previous year. This reduction was driven by a fall in contributions from public donors, as funding from governments and EU institutions decreased by US$2.1 billion. Almost half of the 20 largest donors reduced their contributions by more than 10%. Funding from the United Arab Emirates (UAE) fell by 71% (US$1.5 billion) in 2019, following a rise of US$1.8 billion in 2018.
The volume of funding requested for UN-coordinated appeals continued to grow in 2019, reaching a new high of US$30.4 billion. Despite the overall fall in international humanitarian assistance, funding committed through UN-coordinated appeals rose by 11% in 2019, to a record high of US$19.3 billion. The gap reduced between requirements and funding provided: 60% of appeal requirements were met in 2018 and 64% in 2019 (the highest since 2013).
The latest comprehensive data on assistance targeted to respond to need shows that Yemen, rather than the Syrian Arab Republic, was the largest recipient of international humanitarian assistance in 2018. Funding to Yemen rose sharply by 145%, to US$5.0 billion.
Funding for disaster risk reduction (DRR) is critical in addressing the impacts of climate change on the most vulnerable. Reporting indicates that DRR funding is well targeted. In 2018, 76% (US$973 million) of total official development assistance with a primary focus on DRR went to countries at ‘very high’ or ‘high’ risk of experiencing natural hazards.
International humanitarian assistance
Figure 2.1: International humanitarian assistance fell by US$1.6 billion in 2019, as funding from public donors decreased
International humanitarian assistance, 2015–2019
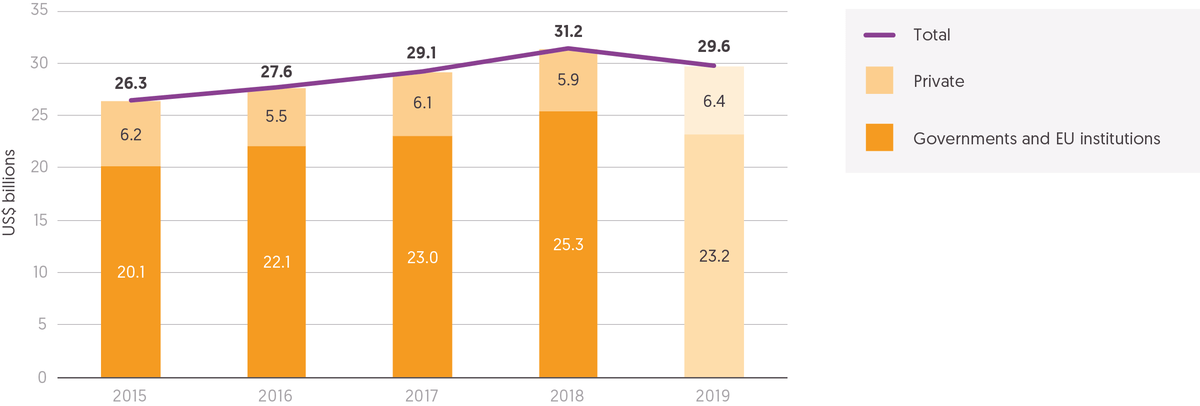
The reduction in total international humanitarian assistance was driven by a fall in funding from governments and EU institutions, which decreased by 8% (US$2.1 billion), while funding from private donors is estimated to have grown by 8% from 2018 to 2019, to US$6.4 billion.
Source: Development Initiatives based on Organisation for Economic Co-operation and Development (OECD) Development Assistance Committee (DAC), UN Office for the Coordination of Humanitarian Affairs (OCHA) Financial Tracking Service (FTS), UN Central Emergency Response Fund (CERF) and our unique dataset for private contributions.
Notes: Figures for 2019 are preliminary estimates. Totals for previous years differ from those reported in previous Global Humanitarian Assistance reports due to deflation and updated data and methodology (see our online ‘Methodology and definitions’). Data is in constant 2018 prices.
International humanitarian assistance reduced by 5% from 2018 to 2019, following a period of steady, sustained growth in the preceding four years.
- In 2019, total international humanitarian assistance from governments and EU institutions and estimated contributions from private donors decreased by US$1.6 billion to US$29.6 billion.
- The fall in volumes of total international humanitarian assistance from 2018 to 2019, follows four years of steady growth during which total assistance grew by US$4.9 billion, an 18.6% increase over 2015–2018. Indeed, this marked the first fall in total assistance since 2012. Nonetheless, total international humanitarian assistance in 2019 remained 12% (US$3.3 billion) higher than in 2015.
- The reduction in total international humanitarian assistance was driven by a fall in funding from governments and EU institutions, which decreased by 8% (US$2.1 billion).
- The reduction in 2019 from governments and EU institutions interrupts a trend of sustained growth in which funding increased by US$5.2 billion, a 26% increase, between 2015 and 2018. Despite the fall in 2019, contributions from governments and EU institutions are 15% (US$3.1 billion) higher than in 2015.
- Estimated contributions of international humanitarian assistance for 2019 from private donors indicate that the total volume of assistance increased again after a drop in 2018. Funding from private donors is estimated to have grown by 8% from 2018 to 2019, to US$6.4 billion.
- Over the period 2015 to 2019, contributions of private international humanitarian assistance are estimated to have grown by 3% (US$192 million).
How did assistance compare with requirements set out in appeals?
Figure 2.2: Volumes to UN-coordinated appeals grow for fourth consecutive year, as funding gap for these appeals closes
Funding and unmet requirements, UN-coordinated appeals, 2010–2019
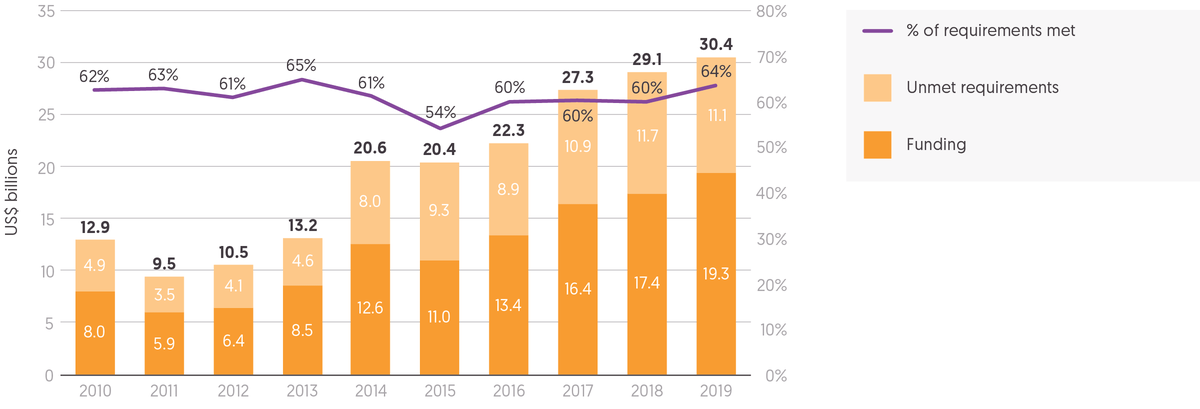
In 2019, funding requirements for UN-coordinated appeals rose to a high of US$30.4 billion and more than a third (36%) were not fulfilled.
Source: Development Initiatives based on UN OCHA FTS and UNHCR data.
Notes: From 2012 data, including the regional response plans and regional response and resilience plans to Syria, South Sudan, DRC, Burundi, Nigeria, CAR, Yemen, Building Resilience and Solutions for Afghan Refugees in South-West Asia and Regional Refugee and Migrant Response Plan for Europe and for Refugees and Migrants from Venezuela coordinated and tracked by UNHCR. Data is in current prices.
The UN Consolidated Appeals Process seeks to provide a strategic approach to coordinating the planning, funding, implementing and monitoring of humanitarian action. Through this process, consolidated appeals are developed that identify humanitarian need in major crises and the assistance provided by UN agencies and NGOs, based on Common Humanitarian Action Plans. In 2019, the volume of assistance requested through these UN-coordinated appeals grew for the fourth consecutive year, reaching a new high.
- In 2019, US$30.4 billion was requested through UN-coordinated appeals, a 5% rise from 2018.
- This increase represents the fourth consecutive annual increase in appeal requirements. Appeal requirements in 2019 were 49% higher than in 2015 (a rise of US$10.0 billion) and 136% higher than in 2010 (a rise of US$17.5 billion).
- In 2019, the number of UN appeals increased by 2 from 2018, to 36.
- The aggregate increase in appeal requirements was driven by large growth in requirements in Yemen and the emergence of new appeals for 2019.
- Appeal requirements for the crisis in Yemen grew by US$1.1 billion (an increase of 35%) to US$4.2 billion. However, despite this rise and a 4% fall in the requirements for the Syria Regional Refugee and Resilience Plan (3RP), the Syria crisis still demanded the greatest volume of resources, with total requests for US$5.4 billion. Together these two appeals accounted for almost a third (32%) of all appeal requirements.
- Other than that in Yemen, the appeal in Sudan was the only one among the ten largest (by requirements) that saw an increase in funding requested. Requirements for the UN-coordinated appeal in Sudan increased by US$142 million (a 14% rise).
- Large decreases in requirements from 2018 to 2019 were seen for appeals in Somalia (decreasing by US$465 million, a 30% reduction) and in Ethiopia (decreasing by US$333 million, a 28% reduction).
- Counter-balancing these decreases were new regional and country appeals responding primarily to the Venezuelan refugee crisis and the impact of cyclones, flooding and food insecurity in Mozambique and Zimbabwe. In 2019, the regional response plan for Venezuela requested US$738 million. In southern Africa, appeals for Mozambique had requirements of US$621 million, and for Zimbabwe of US$468 million.
As requirements for UN-coordinated appeals increased in 2019, so did funding to meet these requirements. Total funding committed towards UN-coordinated appeals increased for the fourth consecutive year, to its highest-ever level. With large increases to a number of appeals and funding to new appeals, the funding gap between requirements and funding closed.
- In 2019, total funding of US$19.3 billion was provided towards UN-coordinated appeals, an 11% increase from 2018 and the highest volume of funding ever committed.
- The gap between requirements and funding reduced by volume, decreasing from US$11.7 billion in 2018 to US$11.1 billion in 2019, and as a proportion of requirements met, from 60% in 2018 to 64% in 2019. This represents the second-highest proportion of appeal requirements met in the past decade, although remains consistent with the trend for the period.
- Large increases in funding (in excess of US$100 million) were evident for the existing appeals in Yemen (up 36%, to US$3.6 billion), Lebanon (up 18%, to US$1.2 billion) and Iraq (up 30%, to US$657 million).
- New appeals also contributed significantly to the growth in total funding. Five new country plans (HRPs) and a new regional plan (RRP) were launched in 2019. In total, US$1.0 billion was committed to new appeals, including US$387 million to the regional plan for Venezuela (and for country plans), US$295 million for Mozambique and US$239 million for Zimbabwe.
- Six countries with appeals in 2018, through which US$148 million was provided, no longer had appeals in 2019.
In 2019, the number of UN-coordinated appeals grew to 36, from 34 in 2018. As in previous years, there was wide variation between individual appeals in the volume of funding required and the extent to which appeal requirements were met.
- The 36 appeals in 2019 ranged in size from the Syria 3RP, requesting US$5.4 billion, to the Iran appeal requesting US$25.0 million.
- Eight appeals accounted for 65% (US$19.6 billion) of all funding requested for UN-coordinated appeals in 2019. These eight appeals (Yemen, Syria 3RP, Syria, DRC, South Sudan, South Sudan RRP, Sudan and Somalia) each requested more than US$1 billion.
As in previous years, there is great variation in the proportion of appeal requirements met. However, in 2019 a larger number, and proportion, of appeals received 75% or more of funding requested, compared to 2018.
- The proportion of total requirements met in 2019 varies from 22%, for the DRC RRP, to 94%, for the Iraq HRP.
Figure 2.3: Wide variation in coverage of appeal requirements continues, but the number of appeals receiving 75% or more of requested funding rises in 2019
UN-coordinated appeal requirements and proportion of requirements met, 2019
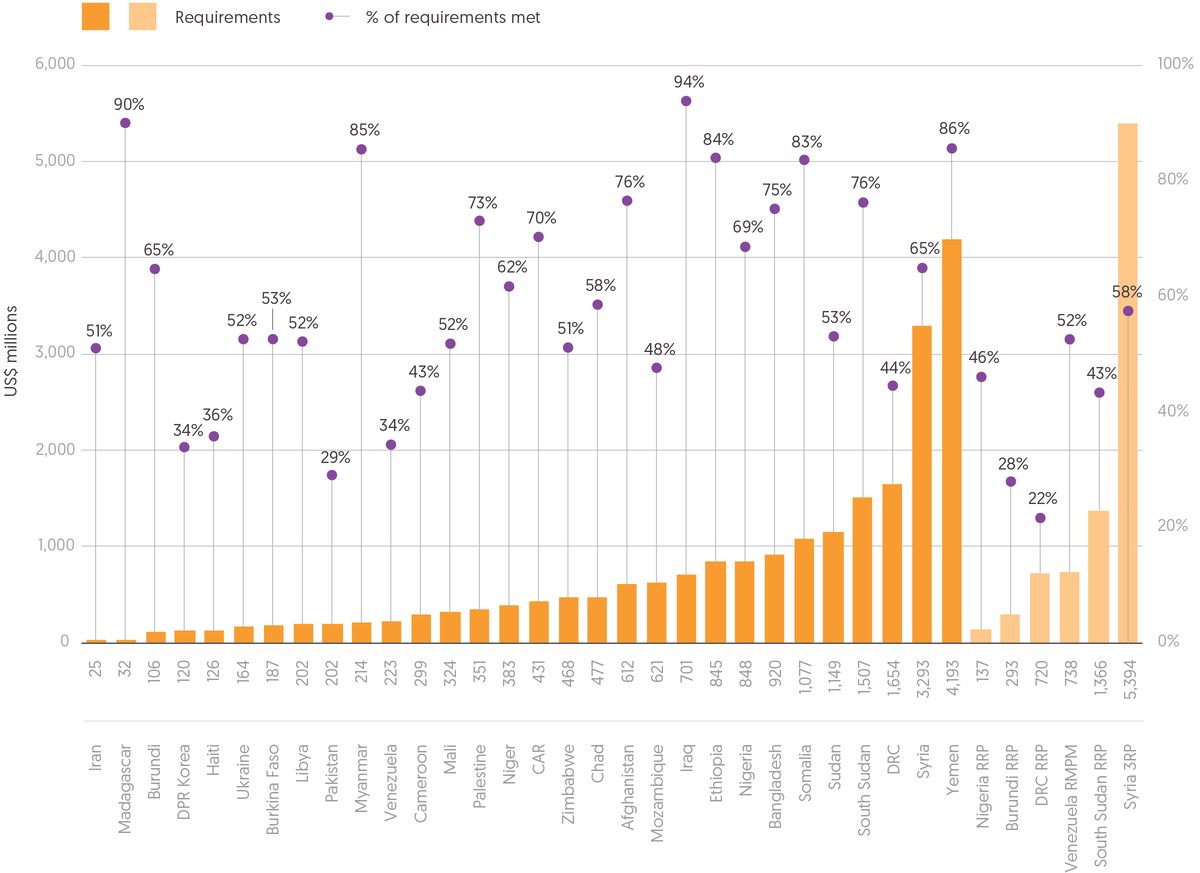
Of the 36 appeals in 2019, 9 received more than 75% of the funds requested. This compares to just 4 of 34 appeals in 2018 that received more than 75% of appeal requirements. Just under a third (11) of the 36 UN-coordinated appeals in 2019 received 50% or less of their funding requirements compared to 13 of 34 appeals in 2018.
Source: Development Initiatives based on UN OCHA FTS and UNHCR data.
Notes: CAR: Central African Republic. DPR Korea: Democratic People's Republic of Korea. DRC: Democratic Republic of the Congo. The five regional response plans (RRPs) and one refugee and migrant response plan (RMRP) are shaded to avoid double counting with country humanitarian response plans (HRPs). Data is in current prices.
- Of the 36 appeals in 2019, 9 received more than 75% of the funds requested (Madagascar, Myanmar, Afghanistan, Iraq, Ethiopia, Bangladesh, Somalia, South Sudan and Yemen). This compares to just 4 of 34 appeals in 2018 that received more than 75% of appeal requirements.
- Just under a third (11) of the 36 UN-coordinated appeals in 2019 received 50% or less of their funding requirements, of which only the DRC HRP (22%) received less than 25%. This compares to 13 of 34 appeals in 2018.
Increases and decreases in the coverage of appeal requirements in excess of 10% occurred in more than a quarter of appeals.
- The coverage of appeal requirements increased in seven crises by more than 10%, with six of these appeals having over 20% more of their funding requirements fulfilled in 2019 than in 2018. These seven appeals were: Ethiopia (coverage up by 28%), Somalia (up 28%), State of Palestine (up 27%), Libya (up 27%), Haiti (up 23%), Central African Republic (up 21%) and Ukraine (up 14%).
- The proportion of appeal requirements met reduced by more than 10% in 2019 from 2018 in three appeals: Pakistan (down by 33%), Burkina Faso (down 14%) and the DRC RRP (down 16%).
In 2019, 25 countries were identified as ‘forgotten crises’ in European Civil Protection and Humanitarian Aid Operations’ (ECHO’s) latest assessment. [1]
- Among this group of 25 were 14 countries with HRPs and 3 that were part of RRPs. The average request from each of the 14 countries with HRPs was US$315 million; 5 of these 14 countries received 50% or less of requirements, while the average received was 54%.
- The volume of funding received by these forgotten crises with appeals ranged from US$14 million to Burundi, as country-component of DRC RRP, to US$608 million to Sudan’s HRP.
- The eight forgotten crises without appeals, or requirements as part of regional response plans, were in the Philippines, Algeria, Mauritania, Senegal, El Salvador, Guatemala, Honduras and Mexico.
Red Cross appeals
The international Red Cross and Red Crescent Movement (RCRC) sets out its requirements separately from UN-coordinated appeals. In 2019, following three years of consecutive growth, funding to the International Federation of Red Cross and Red Crescent Societies (IFRC) fell sharply, while funding to the ICRC grew slightly, continuing a pattern of steady growth.
IFRC emergency appeals relate mostly to disasters associated with natural hazards.
- In 2019, funding to the IFRC increased by 4%: from US$382 million in 2018, to US$398 million in 2019.
- The coverage of IFRC appeal requirements in 2019 decreased sharply in comparison to previous years, reducing to 63% (from 79% in 2018), having ranged between 89% and 79% over the period 2015 to 2018.
ICRC appeals respond mainly to conflict-related situations.
- In 2019, the ICRC received US$1.7 billion, a slight increase from 2018 of US$5 million (up 0.3%). Between 2015 and 2019, ICRC funding has grown every year, increasing by 20% over this period.
- In 2019, 92% of ICRC’s US$1.9 million appeal requirements were met, consistent with the average (92%) for the period since 2015.
International government funding: largest donors
Figure 2.4: The majority of the largest donors reduced their contributions of international humanitarian assistance in 2019
20 contributors of the largest amounts of international humanitarian assistance, governments and EU institutions, 2019
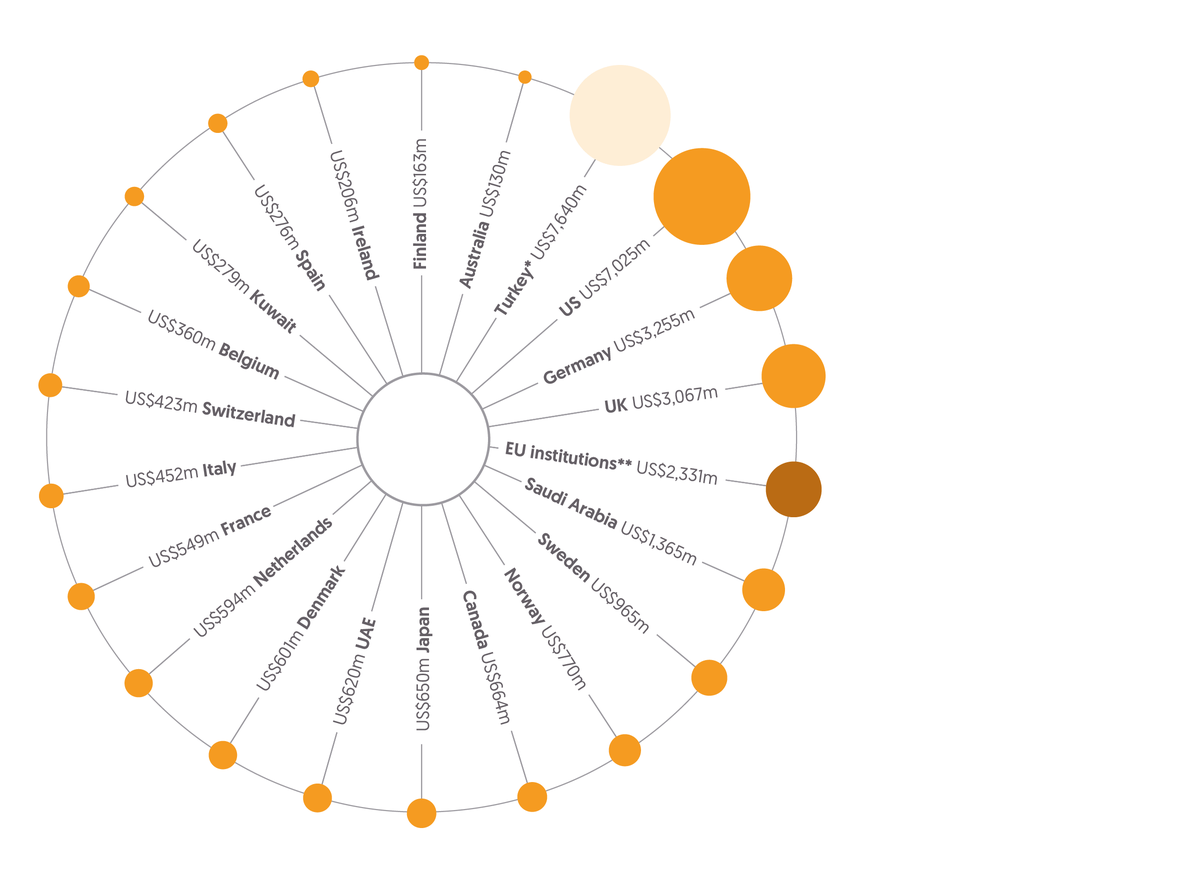
Contributions from the three largest donors (US, Germany and the UK) accounted for 58% of all international humanitarian assistance from public donors in 2019. The US and Germany reduced their contributions by 2% and 4%, respectively. However, the reduction in government donors' contributions in 2019 was driven by the UAE, which reduced their volume of assistance by US$1.5 billion.
Source: Development Initiatives based on OCED DAC, UN OCHA FTS and UN CERF data.
Notes: UAE: United Arab Emirates. 2019 data for OECD DAC is preliminary. Data is in constant 2018 prices. Contributions of EU member states include an imputed amount of their expenditure (see our online ‘Methodology and definitions’). *Turkey is shaded differently because the humanitarian assistance it voluntarily reports to the DAC is largely comprised of expenditure on hosting Syrian refugees within Turkey, and is not therefore strictly comparable with the international humanitarian assistance from other donors in this figure. **EU institutions are also included separately for comparison and are shaded differently to distinguish from government donors.
In 2019, the volume of international assistance provided by the 20 largest donors reduced for the first time since 2012. The majority of donors within this group reduced the volume of assistance provided, with significant falls, in excess of 10%, from almost half.
- In 2019, the volume of international humanitarian assistance provided by the 20 largest public donors decreased by 8%, from US$24.4 billion in 2018 to US$22.4 billion.
- Despite this fall, these donors continued to provide the vast majority of all international humanitarian assistance from public donors, contributing 97% of all allocations, the same proportion as in 2018.
This reduction in contributions in 2019 appears consistent with the gradual slowing in the pace of growth in allocations evident between 2014 and 2017.
- During this period, contributions from the 20 largest donors increased but, year-on-year, by decreasing proportions, rising by 23% in 2014, 12% in 2015, 9% in 2016 and 3% in 2017.
- This trend of slower growth was interrupted in 2018 by an exceptional, near sevenfold rise in contributions from the United Arab Emirates (UAE), increasing by US$1.8 billion. However, in 2019, the volume of assistance provided by the UAE fell almost as sharply, reducing by US$1.5 billion.
The three largest donors of international humanitarian assistance in 2019 remained the US, Germany and the UK, with contributions from the UK rising sharply.
- Contributions from the US, Germany and the UK accounted for 58% of all international humanitarian assistance from public donors. [2]
- The UK increased its contributions of international humanitarian assistance by almost a quarter (24%), an increase of US$588 million, to US$3.1 billion. Notably, growth was also evident from Denmark, up 14% to US$601 million, and Finland, up 15% to US$163 million.
- Overall, 13 governments reduced the volume of international humanitarian assistance they provided in 2019, including 9 that did so by more than 10%. Of these donors, four decreased the volume of assistance provided by more than 20%: the UAE by 71%, Australia by 44% (a fall of US$103 million), Kuwait by 25% (US$94 million) and Italy by 22% (US$130 million).
Countries across the globe continued to host refugees, asylum seekers and internally displaced persons (IDPs) in 2019, with their numbers continuing an established trend of year-on-year growth. The majority of expenditure by governments on efforts to support refugees within their own borders is not reported. [3] However, guidance from the Organisation for Economic Co-operation and Development (OECD) Development Assistance Committee (DAC) does allow for the reporting of a proportion of expenditure as official development assistance (ODA), where certain criteria are met. [4]
In 2019, the available data indicates that spending on hosting refugees in-country decreased. However, the absence of a breakdown of ODA contributions from one government suggests total aggregate expenditure is likely to have fallen by less. [5]
- The volume of reported ODA spent on in-country refugee hosting costs decreased by 13%, from US$10.8 billion in 2018 to US$9.4 billion. This decrease would represent the third consecutive fall in expenditure and would be almost a third (28%) lower than in 2015, when it stood at US$12.9 billion.
- In 2019, three countries accounted for nearly three quarters of all in-country refugee hosting expenditure: Germany (34%), the US (20%) and France (20%).
- Among the 15 countries with the highest in-country refugee hosting expenditure, large increases in expenditure, in excess of US$100 million, were seen in France (up 54% to US$1.2 billion), the UK (up 26% to US$620 million) and the US (up 13% to US$1.8 billion).
Figure 2.5: Eight donors provided more than 0.1% of GNI as international humanitarian assistance in 2019
20 donors providing the most humanitarian assistance as percentage of GNI, 2019
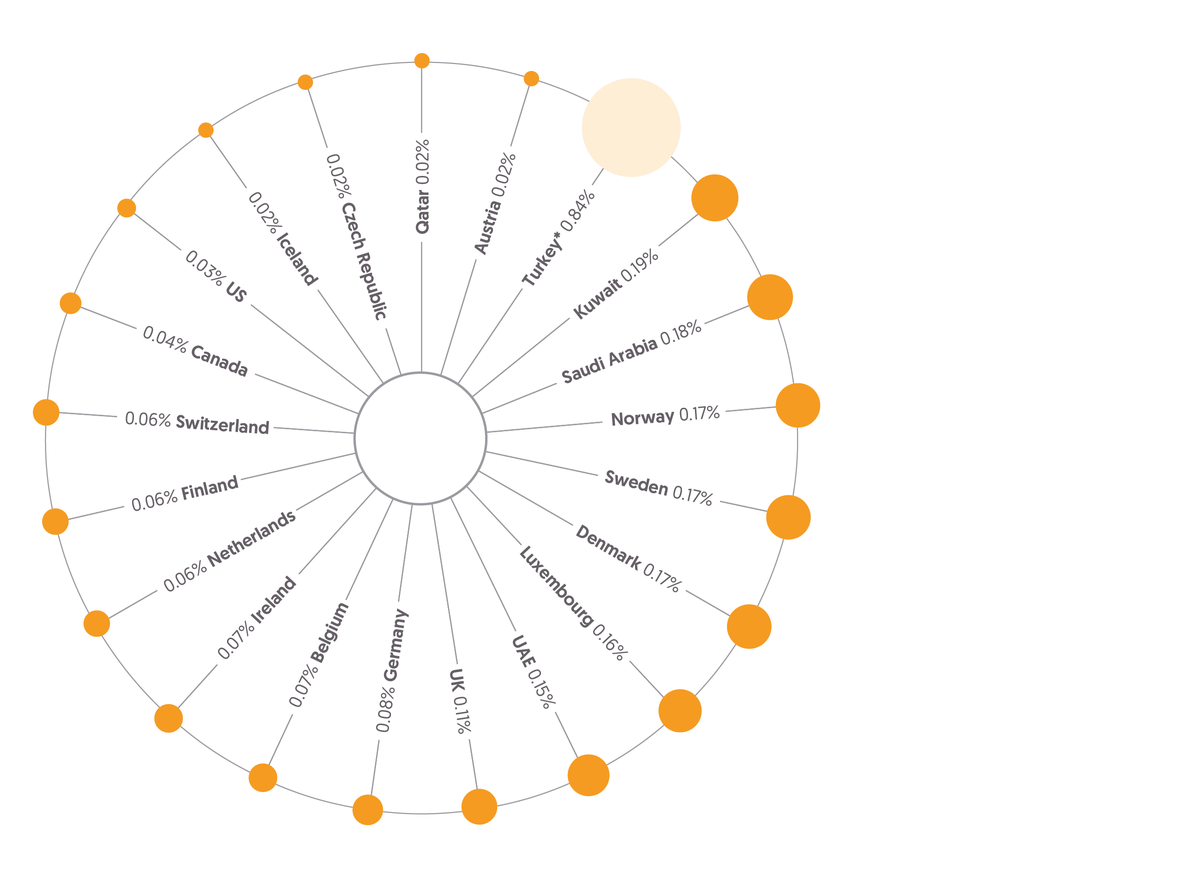
In 2019 the proportion of GNI provided as international humanitarian assistance by the UAE decreased sharply from 0.55% to 0.15%, while Kuwait reduced from 0.26% to 0.19% and Saudi Arabia decreased from 0.21% to 0.18%. Among the three largest donors of international humanitarian assistance (US, Germany and UK), only the UK provide more than 0.1% of GNI as international humanitarian assistance (0.11%).
Source: Development Initiatives based on OECD DAC, UN OCHA FTS, UN CERF, World Bank World Development Indicators and International Monetary Fund World Economic Outlook data.
Notes: UAE: United Arab Emirates. GNI data for 2019 has been estimated using historical data on GNI and real GDP growth rates for 2019. 2019 data for OECD DAC is preliminary. Data is in constant 2018 prices. *Turkey is shaded differently because the humanitarian assistance it voluntarily reports to the DAC is largely comprised of expenditure on hosting Syrian refugees within Turkey, and is not therefore strictly comparable with the international humanitarian assistance from other donors in this figure.
The proportion of GNI spent on international humanitarian assistance indicates the significance of humanitarian spending relative to the size of a country’s economy and other spending priorities. Three Middle Eastern states considerably increased humanitarian spending in 2018, but all allocated a smaller proportion of GNI in 2019.
- The proportion of GNI provided as international humanitarian assistance by the UAE decreased sharply from 0.55% to 0.15%, while Kuwait reduced from 0.26% to 0.19% and Saudi Arabia decreased from 0.21% to 0.18%.
- Despite these reductions, Kuwait, Saudi Arabia and the UAE were the first-, second- and seventh-largest donors by proportion of GNI, and were among only eight countries contributing over 0.1% of GNI as international humanitarian assistance.
- Of the three largest donors of international humanitarian assistance by volume (the US, Germany and the UK), only the UK increased the proportion of its GNI as assistance, up by 0.02% to 0.11%.
International government funding: donor regions
Figure 2.6: Aggregate funding from donors in Europe grows but reduces in all other regions
International humanitarian assistance from governments by donor region, 2010–2019
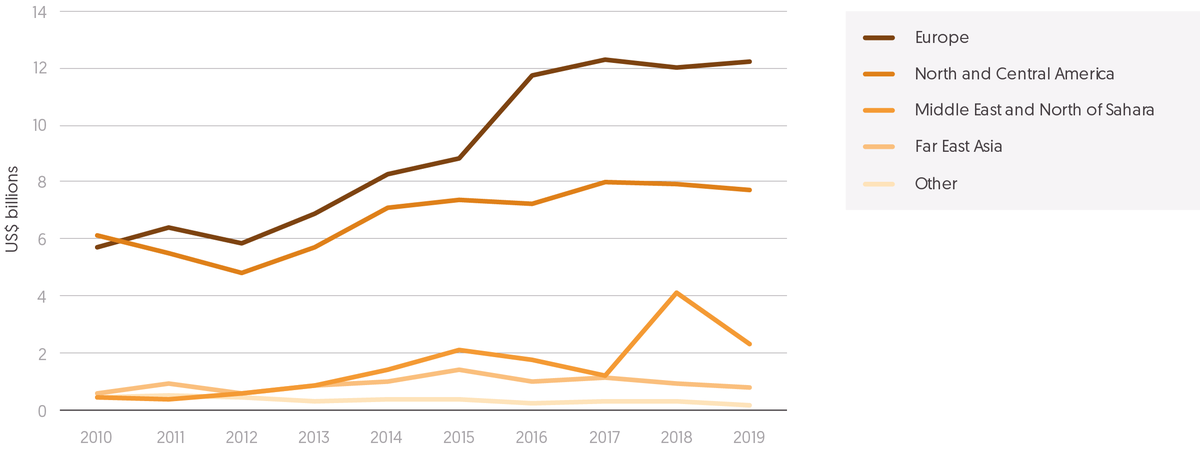
In 2019, contributions from governments in the Middle East and North of Sahara fell by 44% (a decline of US$1.8 billion, from 2018 levels), establishing a trend over the past decade of fluctuating volumes of international humanitarian assistance from this region. Combined bilateral contributions from European governments and EU institutions increased slightly in 2019, up 1.9% from 2018 levels.
Source: Development Initiatives based on OECD DAC, UN CERF and UN OCHA FTS data.
Notes: OECD DAC data for 2019 is partial and preliminary. Funding from OECD DAC donors includes contributions from EU institutions. OECD country naming has been used for regions, with the exception of Middle East and North of Sahara, which has been combined. 'Other’ regions includes the combined total of regions where funding was below US$5 billion over the 10-year period. Calculations include only humanitarian assistance spent internationally, not in-country. See our online ‘Methodology and definitions’. Data is in constant 2018 prices.
The large rise in contributions from governments in the Middle East and North of Sahara in 2018 was not sustained in 2019, with the volume of assistance reducing sharply. Aggregate contributions from European governments and EU institutions and countries in North and Central America varied much less starkly.
- Contributions from governments in the Middle East and North of Sahara fell by 44% (a fall of US$1.8 billion), establishing a trend over the past decade of fluctuating volumes of international humanitarian assistance.
- However, despite this reduction in 2019, the volume of assistance provided by countries within the Middle East and North of Sahara region has increased by 383% since 2010, a rate of growth three times higher than from European governments and EU institutions and more than fourteen times higher than from governments in North and Central America.
- Driving the sharp fall in volumes of assistance from countries in the Middle East and North of Sahara was the US$1.5 billion reduction in contributions from the UAE.
- Combined bilateral contributions from European governments and EU institutions increased slightly in 2019, up 1.9% from 2018 levels. The UK and Germany contributed more than half of this assistance in 2019.
- The overall regional increase from Europe was primarily supported by a large rise in international humanitarian assistance from the UK, rising by 24% (US$633 million), with smaller but notable increases also from Denmark, rising 14% (US$75 million), and Norway, rising 9% (US$63 million).
- Having plateaued in 2018, the aggregate volume of international humanitarian assistance from governments in North and Central America fell slightly, by 3% in 2019.
Private donors
Figure 2.7: The proportions of total assistance from different types of private donors have remained constant in recent years
Sources of private international humanitarian assistance, 2014–2018
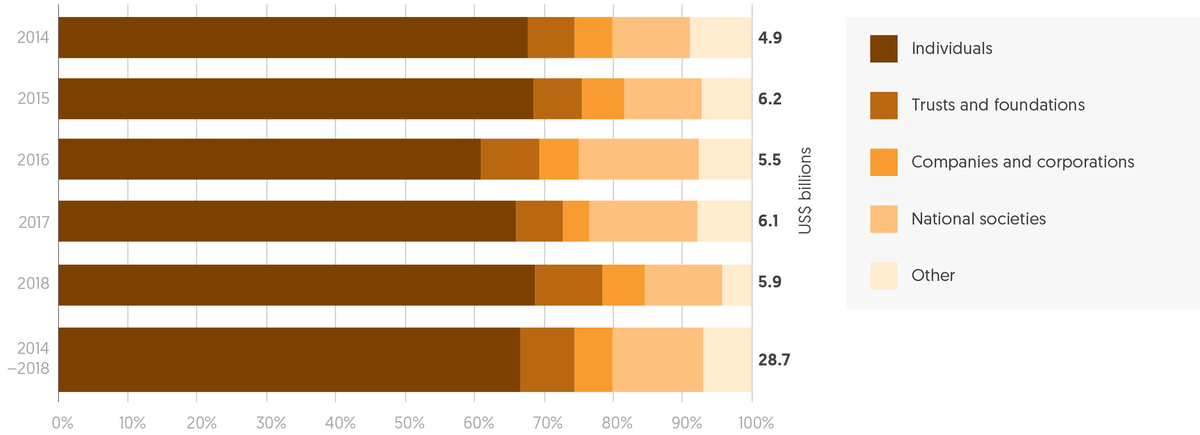
Funding from individuals remained the largest single source of private funding (68%) in 2018. This was followed by national societies (11%), trusts and foundations (10%) and companies and corporations (6%).
Source: Development Initiatives based on our unique dataset of private contributions.
Note: Data is in constant 2018 prices.
Private donors play a significant role in supporting international humanitarian response. Between 2015 and 2019, contributions from private donors have consistently made up just over a fifth of total international humanitarian assistance (see Figure 2.1 ). Data for 2017 and 2018, and estimated contributions for 2019, indicate that total funding from private donors has stabilised at close to US$6.4 billion.
The latest year for which detailed account breakdowns are available to allow analysis of individual sources is 2018. This analysis shows that the proportion of funding from different sources altered from 2017 to 2018. However, these shifts saw a general return to funding patterns evident over the period 2014 to 2018. In 2018, funding from national societies recovered, having reduced sharply in 2016, and funding from individuals reduced, following a marked rise in 2017.
- In 2018, the volume and proportion of total private funding from national societies decreased from US$948 million in the previous year, or 16% of total contributions, to US$656 million, or 11%, the same proportion seen in 2014 and 2015.
- Funding from individuals remained the largest single source of private funding. Funding from individuals grew from 61% to 69% as a proportion of total private contributions, between 2016 and 2018, increasing from US$3.4 billion to US$4.1 billion. The proportion in 2018 (68%) is close to the proportions in 2014 and 2015.
- Funding from foundations and from companies and corporations increased by volume and as a proportion of total private contributions in 2018. For foundations, funding increased from US$404 million (7%) in 2017 to US$576 million (10%) in 2018, while for companies and corporations, contributions grew from US$233 million (4%) in 2017 to US$360 million (6%) in 2018.
Which countries did humanitarian assistance go to?
Figure 2.8: Yemen was the largest recipient of international humanitarian assistance in 2018, as funding more than doubled
10 largest recipients of international humanitarian assistance, 2018
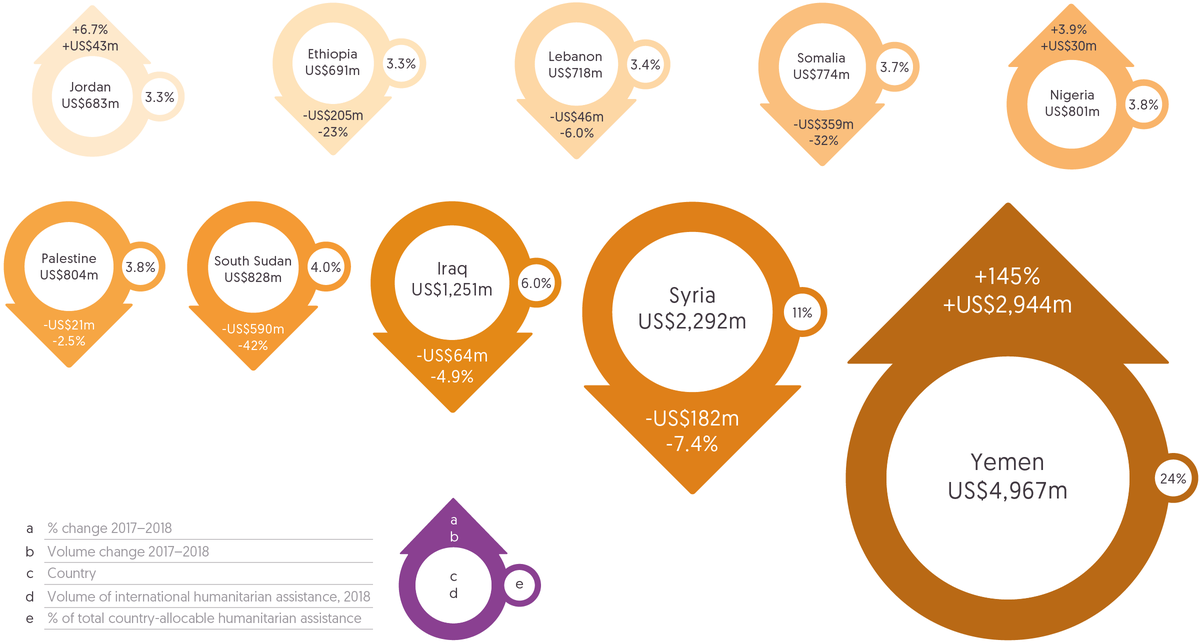
International humanitarian assistance to Yemen in 2018 more than doubled levels seen in 2017, increasing by US$2.9 billion to US$5.0 billion, a rise of 145%. Of the ten countries receiving the most humanitarian assistance, nine were the same in both 2017 and 2018. The new addition in 2018 was Jordan, which replaced Turkey.
Source: Development Initiatives based on OECD DAC, UN OCHA FTS and UN CERF data.
Note: Data is in constant 2018 prices.
The latest comprehensive data from the OECD DAC on where assistance has been targeted in response to need is for 2018. For the first time in seven years, the crisis in Syria did not receive the largest volume of assistance. Large increases in funding provided by Middle Eastern donors in 2018 drove a sharp rise in assistance directed to the crisis in Yemen (see Figure 2.8). Overall, the well-established trend of a small number of crises receiving a large proportion of total humanitarian assistance allocated to specific countries (country-allocable humanitarian assistance) remained unchanged.
- In 2018, international humanitarian assistance to Yemen more than doubled, increasing by US$2.9 billion to US$5.0 billion, a rise of 145%. This rise was driven by large increases in contributions from the UAE and Saudi Arabia. [6] In 2017, 29% of total funding to Yemen came from these two donors. By 2018, this proportion had grown to 69%.
- For the second consecutive year, the volume of assistance channelled to Syria reduced, decreasing by US$182 million to US$2.3 billion, a fall of 7%. This meant that, for the first time since the escalation of civil war in the country in 2012, Syria was not the largest recipient of international humanitarian assistance.
For more than a decade, the ten largest recipients of country-allocable humanitarian assistance have received the majority of available funding, typically just under two thirds of total assistance.
- In 2018, 66% of all country-allocable humanitarian assistance was directed to the ten largest recipients, marking a slight but not untypical increase in the concentration of funding from the 63% of funding channelled to the ten largest recipients in 2017.
The make-up of this group of largest recipients tends to remain relatively stable year-on-year, despite some large variations in the volumes of assistance to individual countries.
- Of the ten countries receiving the most humanitarian assistance, nine were the same in both 2017 and 2018. The new addition in 2018 was Jordan, which replaced Turkey. In 2017, Turkey was the eighth-largest recipient. However, a 33% fall in contributions (from US$803 million to US$541 million) meant Turkey became the thirteenth-largest recipient in 2018.
- The relative stability among the membership of the group of largest recipients is a product of the nature of crisis in these countries. In 2018, all of the ten largest recipients were experiencing protracted crisis. [7]
- In addition to the large increase in assistance to Yemen in 2018, large variations in the volume of funding between the ten largest recipients were also evident. Contributions to South Sudan fell by 42% (from US$1.4 billion to US$828 million), to Somalia by 32% (from US$1.1 billion to US$774 million) and to Ethiopia by 23% (from US$896 million to US$691 million).
- Overall, seven of the ten largest recipients witnessed falls in the volume of assistance they received from 2017 to 2018. In addition to Yemen, Nigeria and Jordan were the only other two countries among the ten largest recipients to see increases in assistance provided, rising 4% (US$30 million) and 7% (US$43 million), respectively.
Outside the ten largest recipients, there were large rises and falls in the volume of funding to a number of other crises.
- Notable increases in the volume of international humanitarian assistance from 2017 to 2018 were seen, with growth of 62% in Bangladesh (11th-largest recipient in 2018), in response to the Rohingya refugee crisis, from US$413 million to US$668 million, in DRC (12th) of 23%, from US$508 million to US$624 million, in Chad (18th) of 47%, from US$153 million to US$224 million, and in Niger (20th) of 28%, from US$172 million to US$220 million.
- In addition to the decrease in assistance to Turkey, highlighted above, a notable fall outside the ten largest recipients was seen in contributions to Uganda (19th-largest recipient in 2018), with a 36% reduction, from US$350 million to US$223 million.
The income-group profile of the ten largest recipients of international humanitarian assistance remained unchanged in 2018 from 2017.
- Five of the ten largest recipients were low-income countries in 2018 (Yemen, Syria, Somalia, South Sudan and Ethiopia). These low-income countries received 46% of all country-allocable humanitarian assistance.
- Two of the ten largest recipients were lower-middle-income countries (Palestine and Nigeria), accounting for 8% of country-allocable humanitarian assistance, while three were upper-middle-income countries (Iraq, Lebanon and Jordan), receiving 13% of assistance.
ODA for disaster risk reduction
Figure 2.9: ODA focused on disaster risk reduction is targeted to countries most in need, although a small number receive a large proportion
ODA with primary focus on disaster risk reduction (DRR) to country recipients, by exposure to natural hazards, 2018
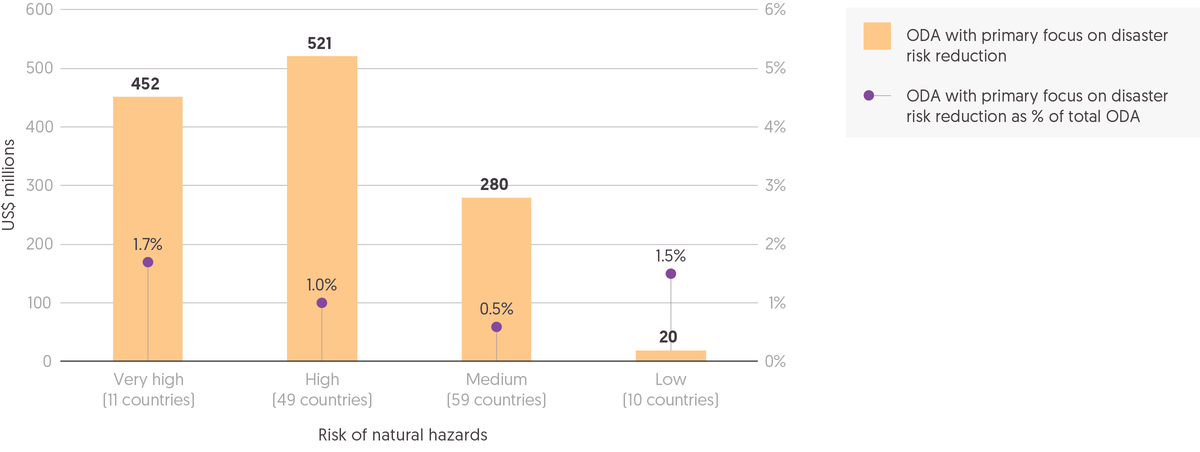
In 2018, a total of US$1.3 billion ODA was provided for activities with DRR as a primary focus. Of this total, 36% (US$452 million) went to 11 countries at very high risk of experiencing natural hazards, with a further 41% (US$521 million) to 49 countries at high risk.
Source: Development Initiatives based on OECD DAC CRS and Index for Risk Management.
Notes: Data is in constant 2018 prices. Analysis includes projects under the disaster risk reduction (DRR) purpose code, projects marked with a 2 in the DRR marker and projects flagged by a keyword search on CRS 2018 data. Figures include country-allocable aid only. Total ODA refers to total gross bilateral ODA as recorded in the CRS. Countries grouped by Index for Risk Management exposure to natural hazards indicator scores: 6.9 or higher grouped as 'very high'; 4.7–6.9 grouped as 'high'; 2.8–4.6 grouped as 'medium'; 2.7 or lower grouped as 'low'.
Despite immediate global attention on the Covid-19 pandemic, climate change is likely to have more profound and long-lasting impacts on people’s lives. This is already evident in the increased occurrence of disasters associated with natural hazards, resulting in more vulnerable people in need of humanitarian assistance. In 2019, 21 of the 42 countries with the largest populations in need of humanitarian assistance experienced disasters caused by natural hazards (see Chapter 1, Figure 1.3 ). Therefore, it is critical to make humanitarian and developmental investments in broader resilience, as well as in disaster risk reduction (DRR).
Recent improvements in the reporting of ODA for DRR to the OECD DAC Creditor Reporting System include a new DRR purpose code and in 2018 a DRR marker. Donors can now clearly indicate where funded projects have DRR as their primary focus. Analysis was conducted for 2018, the first year for which data with the marker is available. This used the purpose code and marker, combined with a keyword search applied to all projects reported to the OECD DAC, to capture instances where the marker may not have been consistently applied. This analysis shows that funding of activities with DRR as a primary focus appears to be well targeted to countries at ‘very high’ and ‘high risk’ of natural hazards, although a small number of countries receive a large portion of this funding.
- In 2018, ODA of US$1.3 billion was provided for activities with DRR as a primary focus.
- Of this total, 36% (US$452 million) went to 11 countries at very high risk of experiencing natural hazards, with a further 41% (US$521 million) to 49 countries at high risk.
- Nine countries received just over half of all funding for activities with DRR as a primary focus. The two countries receiving the largest amounts were Turkey (high risk), allocated US$168 million (13% of all primary-DRR funding), and Bangladesh (very high risk), allocated US$138 million (11%).
Although it is well targeted, funding for activities with DRR as the primary focus accounts for only a small proportion of total ODA to most countries. The proportion varies however, from less than 1% in a majority of the 60 countries at very high or high risk from natural hazards, to 5–13% in just five of these countries. Other DRR activities are also implemented through projects where DRR is not the primary focus.
- In 2018, for countries that received DRR funding, this funding constituted only 1% of their total ODA allocated.
- Among the 11 countries deemed at very high risk from natural hazards, most received more than 1% of their total ODA for DRR activities. The exceptions were India (0.5%), China (0.3%) and Somalia (0.5%). Five ‘very high risk’ countries received more than 2% of ODA for DRR activities, with the largest proportions to the Philippines (5.6%), Haiti (3.7%) and Bangladesh (2.7%).
- Of the 49 countries at risk of experiencing natural hazards, 21 received more than 1% of their ODA for DRR activities. Particularly large proportions of the total ODA allocated to individual countries were for DRR activities in Tonga (12.6%), Dominica (7.9%), Turkey (5.4%) and Jamaica (5.1%).
Both bilateral and multilateral donors provide significant volumes of funding for projects with DRR as the primary focus.
- In 2018, bilateral donors provided 55% (US$1.0 billion) of total funding for DRR and multilateral organisations provided 45% (US$840 million).
- On average, multilateral organisations provided 2.0% of their total ODA allocations for DRR activities, compared with an average of 0.9% among bilateral donors. The mandates of some multilateral organisations include a more distinct focus on climate change and disaster reduction.
- EU institutions and the International Development Association provided the largest volumes of funding for DRR activities among multilateral organisations, contributing US$307 million and US$218 million in 2018, respectively.
Among bilateral donors, there is wide variation in the volume and proportion of ODA provided for activities where DRR is the primary focus.
- The four largest bilateral donors of ODA for DRR activities, all contributing more than US$100 million in 2018, were the US (US$180 million), Japan (US$152 million), France (US$135 million) and Germany (US$119.3 million).
- The bilateral donors contributing the largest proportion of their total ODA for DRR activities were Ireland (3.3%), Switzerland (2.8%), South Korea (2.3%), New Zealand (2.2%) and Sweden (2.1%), compared to an average of 0.9% for all bilateral donors.
Bilateral donors are consistent in targeting their funding for projects with DRR as a primary focus to countries identified as ‘very high’ or ‘high’ risk of natural hazards, with nine out of ten of the largest donors providing more than two thirds of their funding to recipients in these risk categories.
- When funding to very-high- and high-risk countries is combined, five donors targeted more than 80% of their funding for projects with DRR as a primary focus to these countries: Korea (94%), the Netherlands (88%), Canada (87%), Switzerland (83%) and the UK (81%).
Downloads
Download the PDF version of this report
Download the Global Humanitarian Assistance Report 2020
Download nowNotes
-
1
ECHO, 2019. Forgotten crisis assessment. Available at: https://ec.europa.eu/echo/sites/echo-site/files/annex_4_fca_2019.pdfReturn to source text
-
2
Turkey and EU institutions are not included in these calculations.Return to source text
-
3
See Chapter 1, Figure 1.4. A large number of countries outside the DAC provide support to refugee and IDP populations; of the 20 countries with the largest forcibly displaced populations, only Germany is a DAC member. In addition, Turkey also voluntarily reports some in-country refugee hosting costs to the DAC (US$11.5 million in 2019), although most of the spending it reports to the DAC as humanitarian assistance is also used to support Syrian refugees. Data on expenditure by other hosting countries is not reported to the DAC, making comparative analysis difficult.Return to source text
-
4
Agreed in October 2017, the revised OECD DAC guidelines state that in-donor refugee costs are only those reported under the specific ODA category. Other spending on refugee hosting in these countries that is not reported to this code is not included (see OECD, 2017. DAC high level communique: 31 October 2017. Available at: www.oecd.org/dac/DAC-HLM-2017-Communique.pdf ). The revisions aim to enhance the consistency of reporting between donors as well as transparency of reported costs. For analysis of these guidelines, see Development Initiatives, 2017. ODA modernisation: an update following the October HLM. Available at: /publications/oda-modernisation-update-following-october-2017-hlm/Return to source text
-
5
In 2019, the data available from the OECD DAC CRS does not include a breakdown of Italy’s ODA contributions, and so the volume of ODA expenditure for in-country refugee hosting costs cannot be identified. Between 2016 and 2018, a period for which Italy’s expenditure has been reported, Italy spent an average of US$1.6 billion on in-country refugee support.Return to source text