Read our latest update on Humanitarian funding and reform
Our report 'Falling short? Humanitarian funding and reform' presents the latest data on global humanitarian assistance, as well as progress on Grand Bargain localisation targets, cash and voucher assistance, and anticipatory action.
Visit the reportWe need your feedback
Can you spare five minutes to help improve next year's Global Humanitarian Assistance Report and other publications by Development Initiatives?
Go to surveyThis executive summary sets out the latest key trends in global humanitarian assistance. You can see the top level findings come to life in our short animation .
The Global Humanitarian Assistance Report 2021 looks at an exceptional year. In 2020, the Covid-19 pandemic gripped the world, compounding existing needs and fuelling new crises. Millions more people became in need of humanitarian assistance, and the number of UN humanitarian appeals rose by more than half (from 36 in 2019 to 55 in 2020). Yet, international humanitarian assistance has flatlined for a second consecutive year.
Needs emanating from the impacts of Covid-19 are diverting resources away from other needs, although both are woefully underfunded – far too many people are going without vital support. How the financing response has played out exposes the weaknesses in the current system and its ability to meet people’s needs, as well as highlighting the key role of non-humanitarian actors in crisis contexts to ensure an effective response and recovery. This report sheds light on the current crisis financing landscape, what progress has been made, and where attention must be focused if we are to realise the aim of building back better.
The impacts of Covid-19 on top of existing crises meant humanitarian needs were higher and further reaching than ever in 2020.
- In 2020, an estimated 243.8 million people living in 75 countries were assessed to be in need of humanitarian assistance. This is an additional 19 million people and 10 more countries compared with 2019. Seven countries had the equivalent of over half their populations in need.
- The number of countries experiencing protracted crisis has doubled to 34 in the last six years. [1] Populations living in these countries have an average single-dose vaccination rate of 2.4%, considerably lower than the rate of 12.5% for other developing countries.
- The number of displaced people continued to grow, up 3.4% to 82.1 million, with more than half living in countries at high risk from the impacts of Covid-19.
- The vulnerability of women and girls in humanitarian settings is being compounded by the impacts of the Covid-19 pandemic. However, our research highlights that they are often missing in data, limiting how well their current and future needs can be met.
The implications for poverty reduction are significant, with extreme poverty rising in fragile states over the last decade.
Poverty and crisis have always been inextricably linked, and this relationship stands stark in the current context. The poorest populations in fragile states, countries inherently vulnerable to shocks, have the least capacity to manage when crisis hits. While many countries are starting to focus their sights on pandemic recovery, the poorest populations are falling behind.
Crisis risks and vulnerabilities
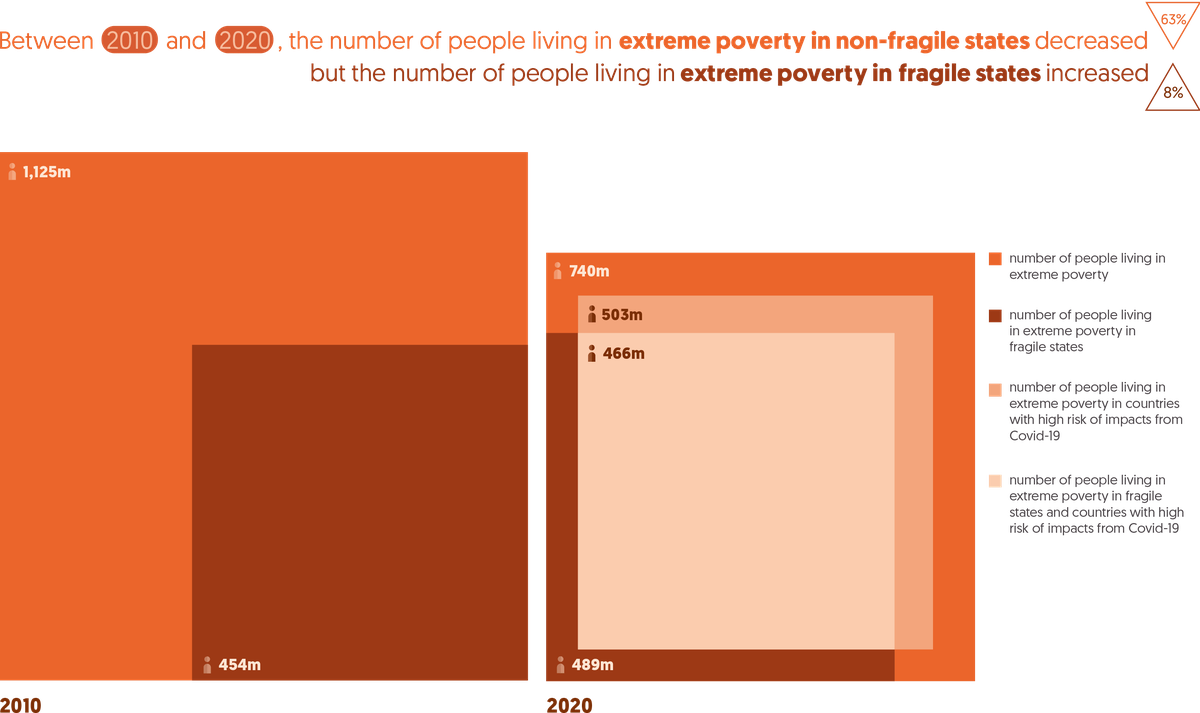
| People living in extreme poverty in fragile states and/or countries with high risk of impacts from Covid-19 | Year | Number of people |
|---|---|---|
| People living in extreme poverty | 2010 | 1,125,011,931 |
| People living in extreme poverty in fragile states | 2010 | 454,365,520 |
| People living in extreme poverty | 2020 | 740,288,342 |
| People living in extreme poverty in fragile states | 2020 | 489,404,339 |
| People living in extreme poverty in countries at high risk of impacts from Covid-19 | 2020 | 503,379,190 |
| People living in extreme poverty in fragile states and countries at high risk of impacts from Covid-19 | 2020 | 466,482,008 |
Note: Data for 2020 is preliminary.
- Between 2010 and 2020, extreme poverty in fragile states grew 8% while falling 63% in non-fragile states. [2] Fragile countries now account for two thirds of the world’s people experiencing extreme poverty.
- Almost all people in extreme poverty living in fragile countries are in places identified as being at either high or very high risk from the impacts of the Covid-19 pandemic.
- Covid-19 has increased food insecurity, something that disproportionately impacts people in poverty and is driving greater humanitarian needs. Our analysis shows that, in regions where there is a food crisis, emergency or famine, 82% of the population live below the international poverty line ($3.20 a day).
Against this backdrop of rising, complex and intersecting needs of people living in countries affected by crisis, we look at the financing response.
In 2020, international humanitarian assistance plateaued at US$30.9 billion and support for non-Covid humanitarian needs fell.
International humanitarian response
2016–2020
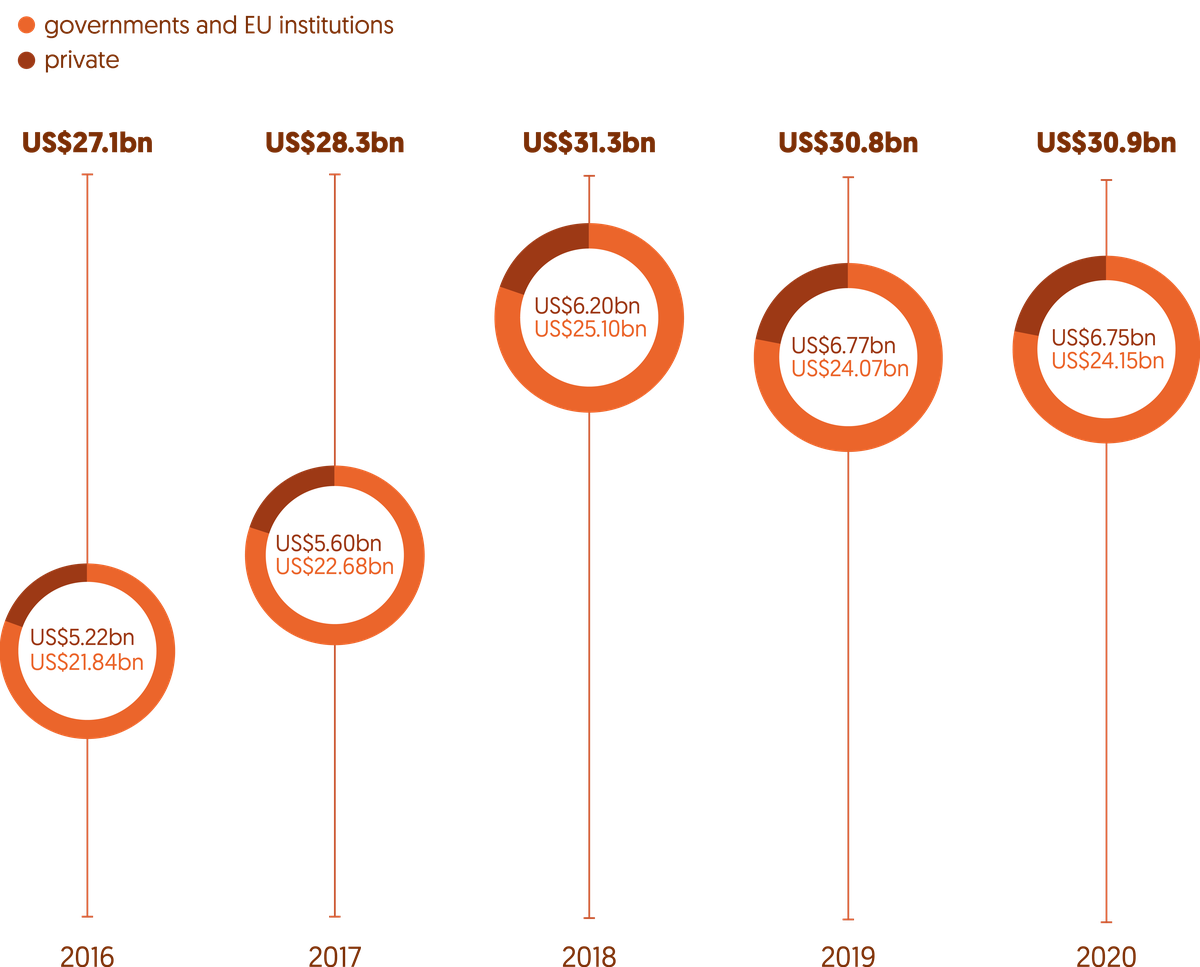
| 2016 | 2017 | 2018 | 2019 | 2020 | |
|---|---|---|---|---|---|
| Governments and EU institutions (US$ billions) | 21.8 | 22.7 | 25.1 | 24.1 | 24.1 |
| Private (US$ billions) | 5.2 | 5.6 | 6.2 | 6.8 | 6.7 |
| Total (US$ billions) | 27.1 | 28.3 | 31.3 | 30.8 | 30.9 |
Notes: Data for 2020 is preliminary. Data consists only of humanitarian assistance directed internationally by donors.
This report’s unique analysis shows that, despite unprecedented need, international humanitarian assistance has flatlined. International humanitarian assistance had been growing by an average 12% per year between 2012 and 2018, putting the last two years at odds with earlier trends.
Where does it come from?
Largest five donors by volume, 2020
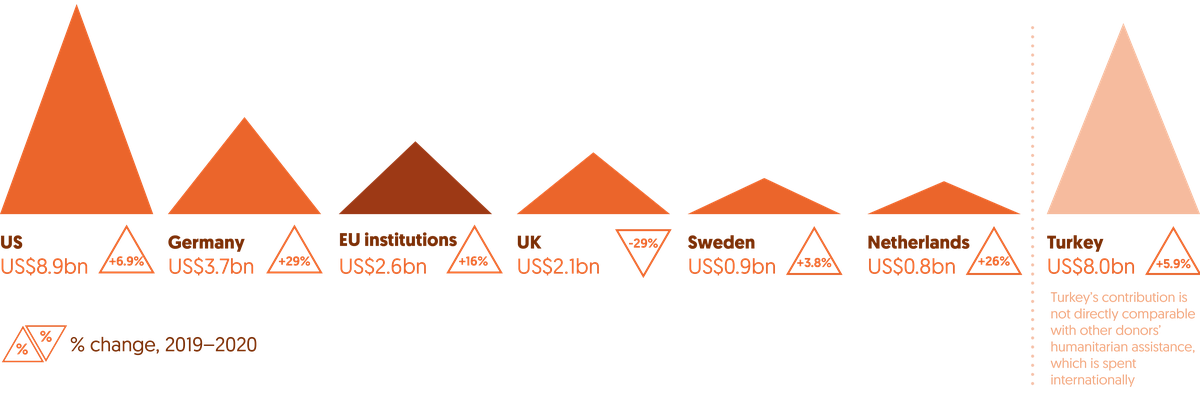
| Country | 2019 (US$ millions) | 2020 (US$ millions) | % change, 2019–2020 |
|---|---|---|---|
| US | 8,326 | 8,903 | 6.9% |
| Turkey* | 7,587 | 8,036 | 5.9% |
| Germany | 2,891 | 3,716 | 29% |
| EU institutions | 2,247 | 2,605 | 16% |
| UK | 2,950 | 2,098 | -29% |
| Sweden | 886 | 919 | 3.8% |
Notes: 2020 data for OECD DAC is preliminary. Data is in constant 2019 prices. ‘Public donors’ refers to governments and EU institutions. Contributions of EU member states include an imputed amount of their expenditure (see our online ‘Methodology and definitions’, Chapter 5). EU institutions are also included separately for comparison and are shaded differently to distinguish from government donors. Turkey is shaded differently because the humanitarian assistance it voluntarily reports to the DAC is largely expenditure on hosting Syrian refugees within Turkey, and so not strictly comparable with the international humanitarian assistance from other donors in this figure.
- Between 2019 and 2020, international humanitarian assistance from governments and EU institutions stagnated at US$24.1 billion, as the UK reduced contributions by almost a third (29%) and Saudi Arabia reduced contributions by more than half (53%).
- 14 of 20 public donors increased funding and Germany stepped up contributions the most, by 29%. However, all donors except Switzerland reduced their levels of funding for humanitarian needs not related to Covid-19, compared to 2019.
- Funding from private donors also stalled in 2020, at US$6.7 billion.
Record levels of humanitarian need were met by record shortfalls in funding, with Yemen worst hit.
UN-coordinated appeals show the scale of need and adequacy of the funding response.
- UN-coordinated appeal requirements grew by 27% in 2020, reaching a record US$38.8 billion. Appeal requirements for countries experiencing protracted crisis in 2020 grew on average by 39% compared to 2019. The number of appeals also grew, from 36 to 55, 17 of which were solely in response to the impacts of the pandemic.
- These appeals were only 52% funded overall, resulting in the largest funding shortfall ever seen of US$18.8 billion. Within that, requirements related to Covid-19 were even worse funded, having just 40% of required funding provided.
The ten largest recipients of international humanitarian assistance remain largely unchanged, but their share of total funding has gone down to its lowest level in a decade. Billions have been diverted towards humanitarian impacts of the pandemic, although this funding also fell far short of amounts needed.
- This group of countries received 57% of total international humanitarian assistance in 2020, down from 66% in 2019.
- They received US$3.0 billion less for needs not related to Covid-19 in 2020 than in 2019, showing that their funding was diverted due to the pandemic.
- Yemen in particular saw a significant drop in total funding received, of US$1.9 billion from the year before.
Where is it going?
Largest five recipients by volume, 2020
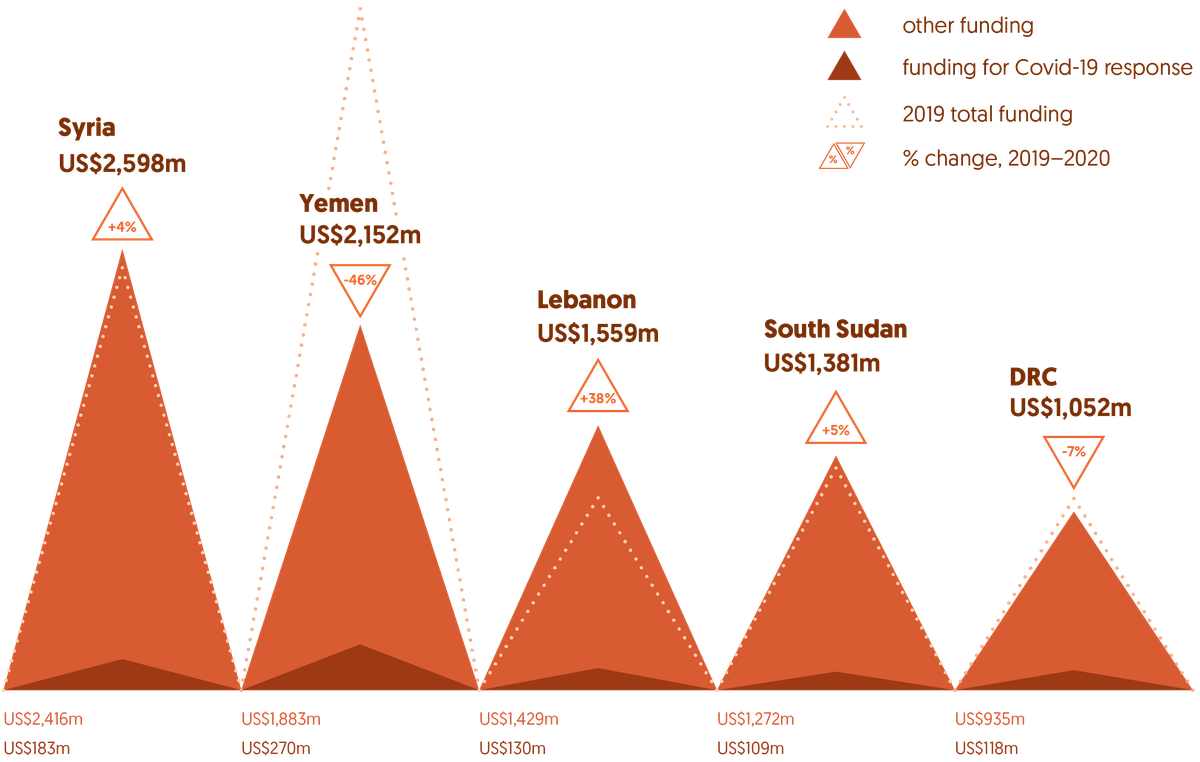
| Rank | Country | 2019 | 2020: Funding for Covid-19 response (US$ millions) | 2020: Other funding (US$ millions) | 2020 total (US$ millions) | % change, 2019–2020 |
|---|---|---|---|---|---|---|
| 1 | Syria | 2,488 | 183 | 2,416 | 2,598 | 4% |
| 2 | Yemen | 4,013 | 270 | 1,883 | 2,152 | -46% |
| 3 | Lebanon | 1,133 | 130 | 1,429 | 1,559 | 38% |
| 4 | South Sudan | 1,309 | 109 | 1,272 | 1,381 | 5% |
| 5 | DRC | 1,129 | 118 | 935 | 1,052 | -7% |
Note: Data for 2020 is preliminary.
Chronic and growing underfunding alongside the increasingly long-term nature of crises makes it critical to join up humanitarian, development and peacebuilding responses. It is also crucial to harness different types of finance, ensuring their coherence with humanitarian responses to meet the needs of crisis-affected populations.
Development actors, including multilateral development banks, have become increasingly active in countries experiencing crisis, and are delivering a growing proportion of assistance in the form of loans.
Official development assistance (ODA) to countries experiencing crisis has sharply increased in recent years. While humanitarian ODA is growing, development ODA remains the largest source of international assistance.
- Total ODA to countries experiencing crisis has risen from 47% of total country-allocable ODA (US$51 billion) in 2010 to 65% (US$94 billion) in 2019.
- Multilateral development banks play an increasingly important role in crisis contexts, with a growing suite of specifically designed crisis response financing mechanisms. For example, the World Bank’s Crisis Response Window disbursed US$3.0 billion between 2011 and 2018, in response to 27 crises.
- Financing from multilateral development banks to countries experiencing crisis is increasingly in the form of loans, which have more than doubled in volume over the last decade, to 87% of total ODA from multilateral development banks to the 20 largest recipients of humanitarian assistance.
- While allocating significant volumes of finance for crisis response, development actors can be slow to provide it. For example, within six crisis case studies, the World Bank committed 43% (US$1.9 billion) of financing, yet after 18 months had disbursed only 28% of this.
It is not possible to track development finance flows in the same way as humanitarian flows, especially at subnational level. Improved data availability in this regard would help to enhance the coherence and coordination of development and humanitarian responses, and the overall effectiveness and efficiency of assistance to countries in crisis.
Covid-19 has increased impetus for improving the effectiveness and efficiency of humanitarian response. There has been some promising progress on this, but Grand Bargain commitments remain far from being met.
How does it get there?
Funding channels, 2019
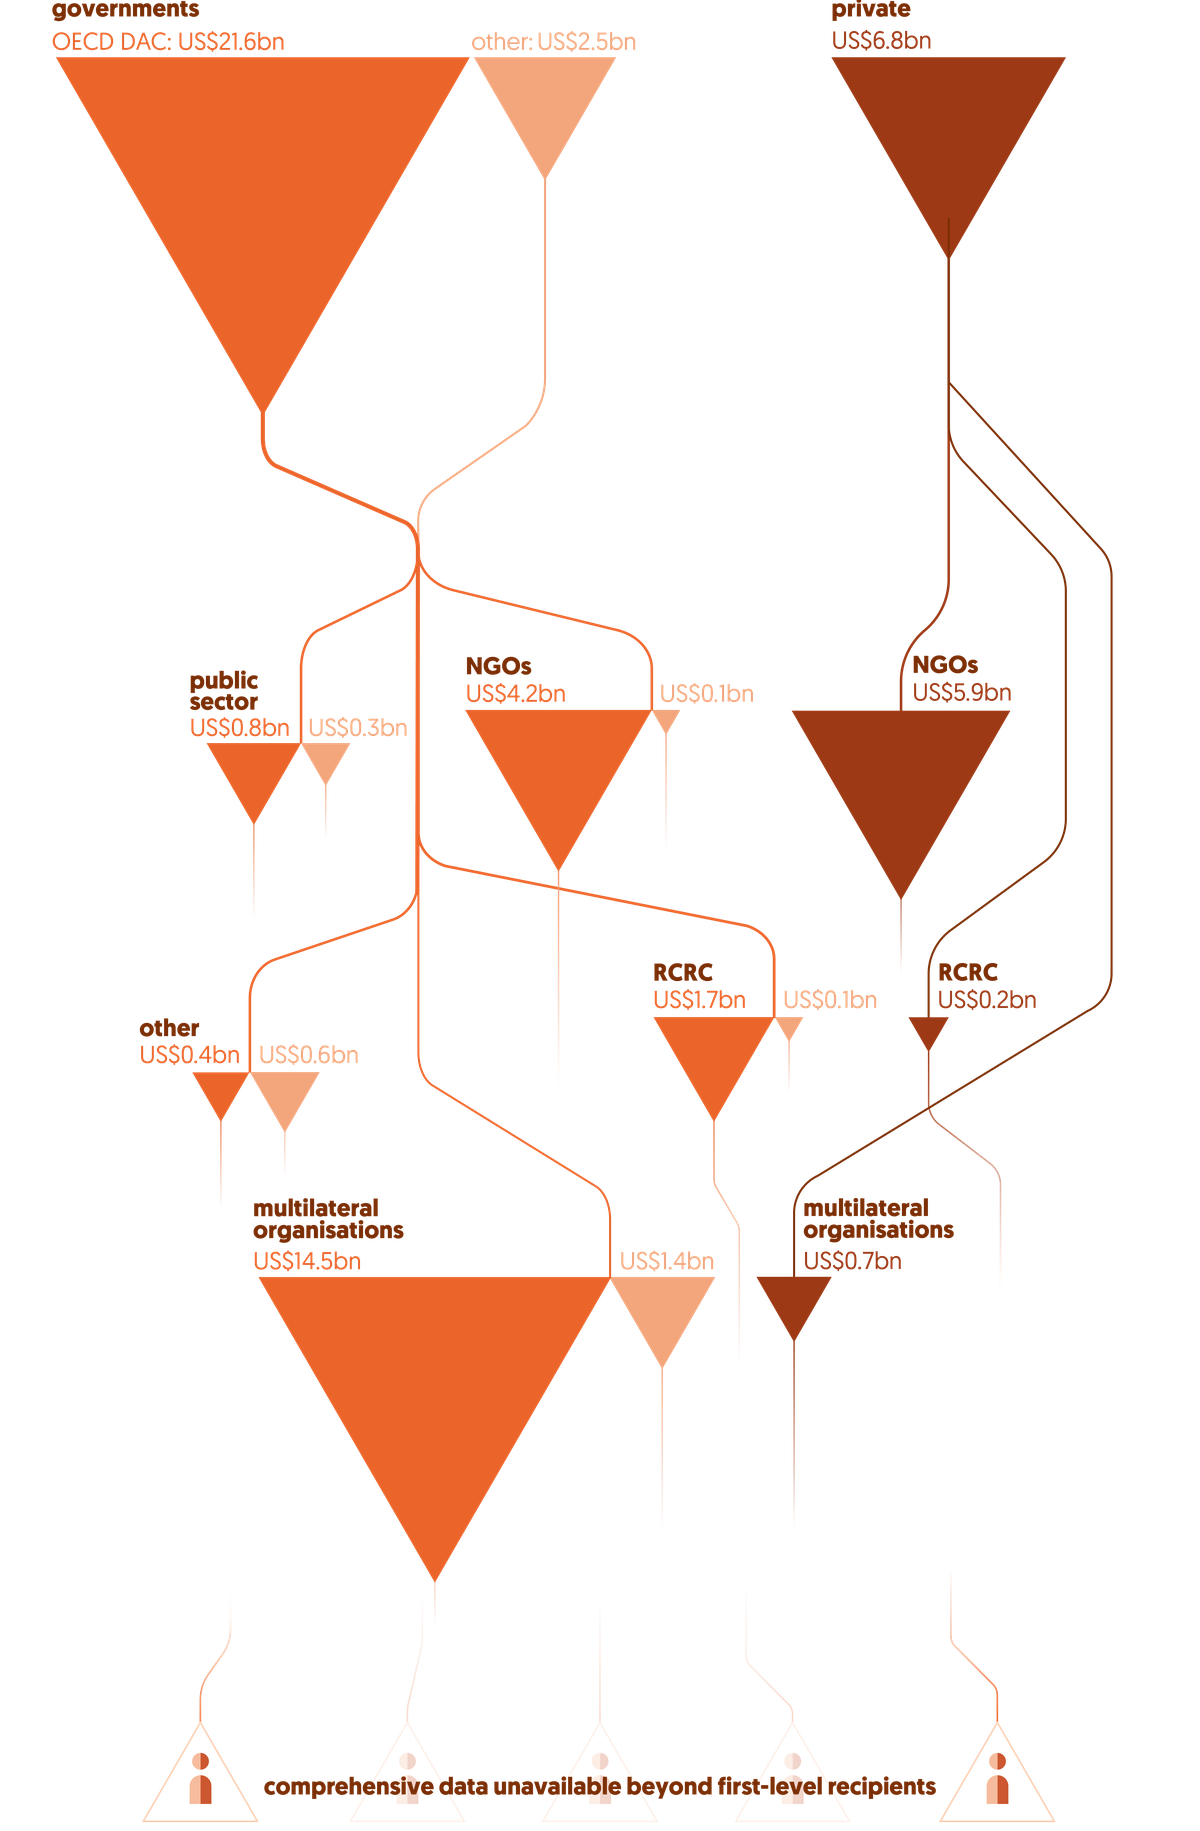
| Donor | First-level recipient | Volume (US$ billions) |
|---|---|---|
| OECD DAC governments | Multilateral organisations | 14.5 |
| OECD DAC governments | NGOs | 4.2 |
| OECD DAC governments | RCRC | 1.7 |
| OECD DAC governments | Public sector | 0.8 |
| OECD DAC governments | Other | 0.4 |
| OECD DAC governments | Total | 21.6 |
| Other governments | Multilateral organisations | 1.4 |
| Other governments | NGOs | 0.1 |
| Other governments | RCRC | 0.1 |
| Other governments | Public sector | 0.3 |
| Other governments | Other | 0.6 |
| Other governments | Total | 2.5 |
| Private | Multilateral organisations | 0.7 |
| Private | NGOs | 5.9 |
| Private | RCRC | 0.2 |
| Private | Total | 6.8 |
Efficiency and effectiveness: What progress is being made on the Grand Bargain?
Direct funding to local and national actors, 2016–2020
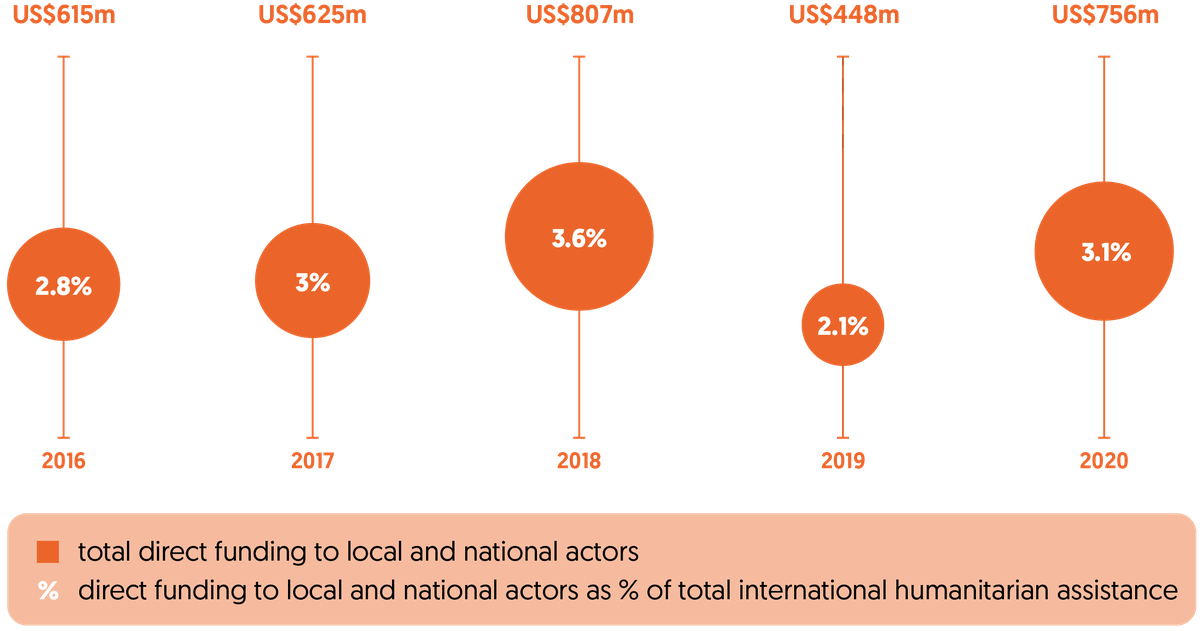
| 2016 | 2017 | 2018 | 2019 | 2020 | |
|---|---|---|---|---|---|
| National governments (US$ millions) | 529 | 491 | 686 | 324 | 624 |
| Local and national NGOs (US$ millions) | 65 | 125 | 110 | 109 | 103 |
| National societies (US$ millions) | 22 | 9 | 11 | 15 | 29 |
| Total funding to local and national actors (US$ millions) | 615 | 625 | 807 | 448 | 756 |
| Direct funding to local and national actors as a % of total funding | 2.8% | 3.0% | 3.6% | 2.1% | 3.1% |
Note: Data for 2020 is preliminary.
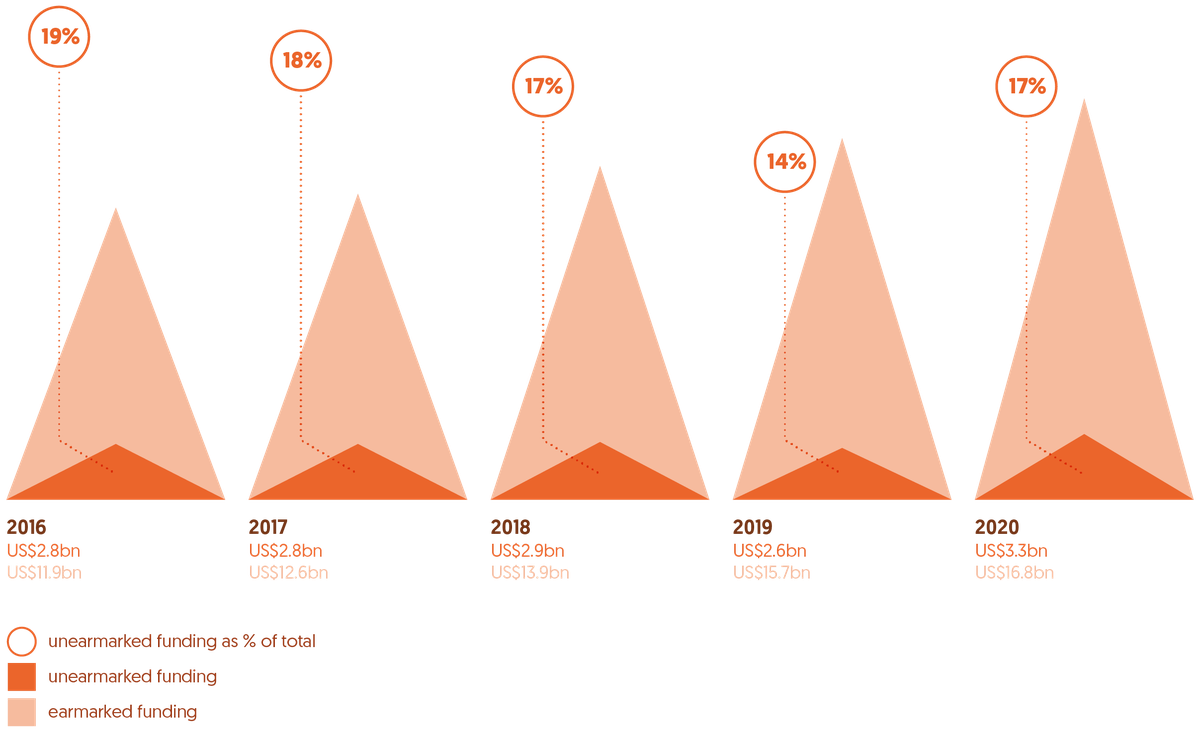
- Unearmarked funding enables more flexible and responsive programming, and increased significantly to nine UN agencies to a record US$3.3 billion. However, this falls short of the target of 30% of all funding by 2020, being just 17% of the total received by these nine UN agencies.
Unearmarked funding, 2016–2020
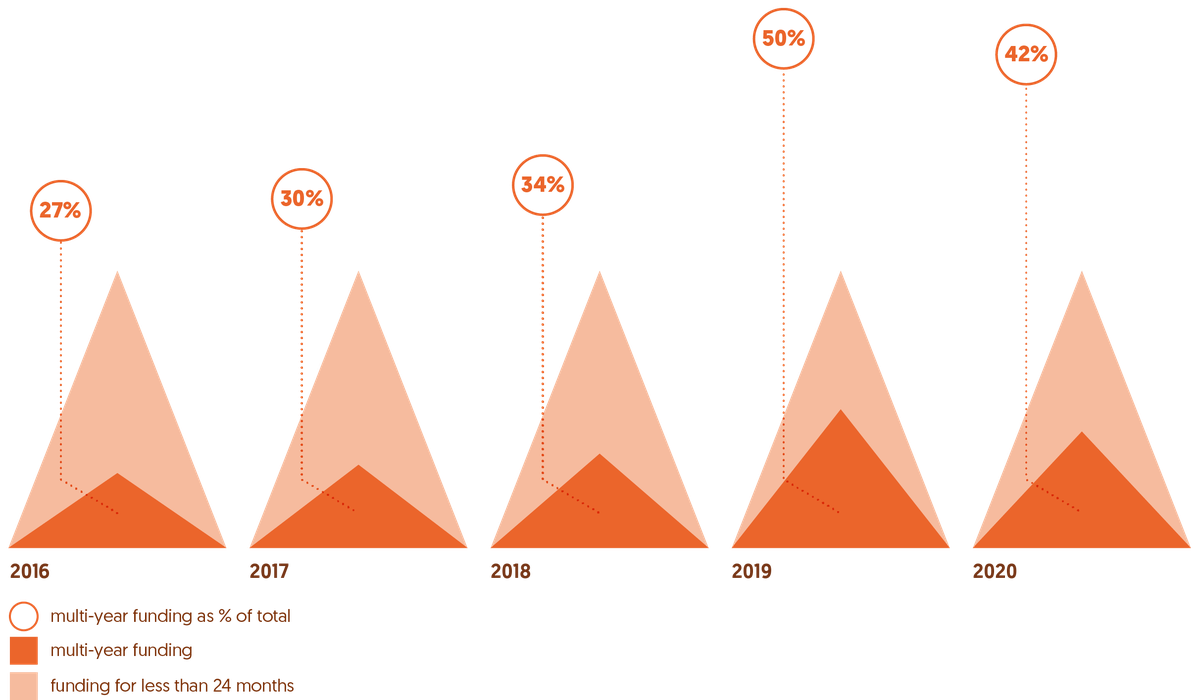
- Multi-year funding is crucial to giving agencies predictable levels of resources. In 2020, it fell from 53% to 42%, but overall growth over the last five years has been significant – up from just 27% in 2016.
- Humanitarian assistance in the form of cash and vouchers rose for a fifth consecutive year in 2020, and was often the delivery mode of choice during the Covid-19 pandemic response.
Cash and voucher assistance, 2015–2020

| 2015 | 2015 | 2016 | 2016 | 2017 | 2017 | 2018 | 2018 | 2019 | 2019 | 2020 | 2020 | |
|---|---|---|---|---|---|---|---|---|---|---|---|---|
| Transfer value (US$ billions) | Total programming costs (US$ billions) | Transfer value (US$ billions) | Total programming costs (US$ billions) | Transfer value (US$ billions) | Total programming costs (US$ billions) | Transfer value (US$ billions) | Total programming costs (US$ billions) | Transfer value (US$ billions) | Total programming costs (US$ billions) | Transfer value (US$ billions) | Total programming costs (US$ billions) | |
| NGOs | 0.4 | 0.5 | 0.6 | 0.7 | 0.7 | 0.9 | 0.7 | 0.9 | 0.8 | 1.0 | 1.2 | 1.5 |
| RCRC | 0.1 | 0.1 | 0.1 | 0.1 | 0.8 | 1.0 | 0.7 | 1.0 | 0.8 | 1.1 | 0.9 | 1.1 |
| UN agencies | 1.0 | 1.4 | 1.6 | 2.0 | 1.7 | 2.2 | 2.1 | 2.8 | 2.7 | 3.5 | 2.9 | 3.7 |
| Other | 0.002 | 0.004 | 0.003 | 0.004 | 0.07 | 0.10 | 0.009 | 0.012 | 0.001 | 0.002 | - | - |
| Total | 1.5 | 2.0 | 2.2 | 2.8 | 3.2 | 4.3 | 3.6 | 4.7 | 4.3 | 5.6 | 5.0 | 6.3 |
Note: Data for 2020 is preliminary.
- Significant improvements to transparency have been made through the Grand Bargain, with more and better-quality publishing to the International Aid Transparency Initiative. However, a continued commitment to further improvements is required to monitor progress and enable accountability. For key Grand Bargain commitments, there is still a lack of comprehensive, publicly available data. Development Initiatives has had to independently collect data on unearmarked and multi-year funding, and cash and voucher assistance.
Setting out the financing response to crisis in 2020 serves as a stark reminder of the unprecedented global challenges we now face.
The humanitarian system was struggling even before the pandemic. There has always been less financing available than needed, and too much reliance on reacting when crisis hits rather than anticipating and reducing risk from shocks. Covid-19 would have likely placed unmanageable strain on even the most effective system, and it has thrown current weaknesses into the spotlight. To build back better, to provide support to all people experiencing crisis when they need it most, progress in reforming the delivery of humanitarian assistance needs to be consolidated and accelerated. This needs to be accompanied by and coordinated with more effective development and peacebuilding interventions in countries experiencing crisis. The data and analysis set out in this report provide a comprehensive evidence base on humanitarian assistance to help show where attention and action is needed, and facilitate accountability for those we rely on to make greater progress.
Graphics illustrating 'International humanitarian response', 'Where does it come from?' and 'How does it get there?' , and associated data, were updated on 29 June 2021. The graphic illustrating 'International humanitarian response' was clarified on 3 August 2021.
Downloads
Download the PDF version of this report
Download the Global Humanitarian Assistance Report 2021
Download nowNotes
-
1
Development Initiatives defines countries experiencing protracted crisis as countries with at least five consecutive years of UN-coordinated humanitarian or refugee response plans as of the year of analysis. Protracted crises often involve more than one crisis happening at once (such as conflict, displacement and natural disasters). They combine acute and long-term needs, requiring strategic support to meet immediate needs and to address structural causes and reduce vulnerabilities to new shocks.Return to source text
-
2
People living in poverty are defined as living on less than $3.20 a day (2011 PPP); people living in extreme poverty are defined as living on less than $1.90 a day (2011 PPP). PPPs are constructed by comparing the cost of a common basket of goods in different countries.Return to source text
