International finance flows 2000–2021
While ODA is an important source of funding for many low- and middle-income countries, it is often one of several significant flows. This factsheet looks at trends in finance flows to ODA-eligible countries from 2000 onwards, focusing particularly on the international financing landscape in 2021.
DownloadsIntroduction
This factsheet analyses several major international finance flows between 2000 and 2021 to countries which were eligible to receive Official Development Assistance (ODA). [1] Focusing predominately on 2021 – the latest year for which data is available for all the flows analysed in this factsheet – it provides an update on a previous factsheet published in 2018. The 2018 paper described key trends in international sources of finance over time and assessed their relative level of significance. In 2021, ODA continued to be a critical source of finance, [2] particularly to least-developed countries (LDCs) and to countries in fragile situations. [3] However, commercial flows still dominated the international financing landscape; these and other international financial flow trends will be explored in this factsheet.
The financial flows presented in this paper have been grouped into the following categories: official, commercial and private; details of which are available in the Appendix . The data discussed in this factsheet can be found in the accompanying dataset.
► Read more from DI about ODA (aid)
► Share your thoughts with us on Twitter or LinkedIn
► Sign up to our newsletter
Key facts
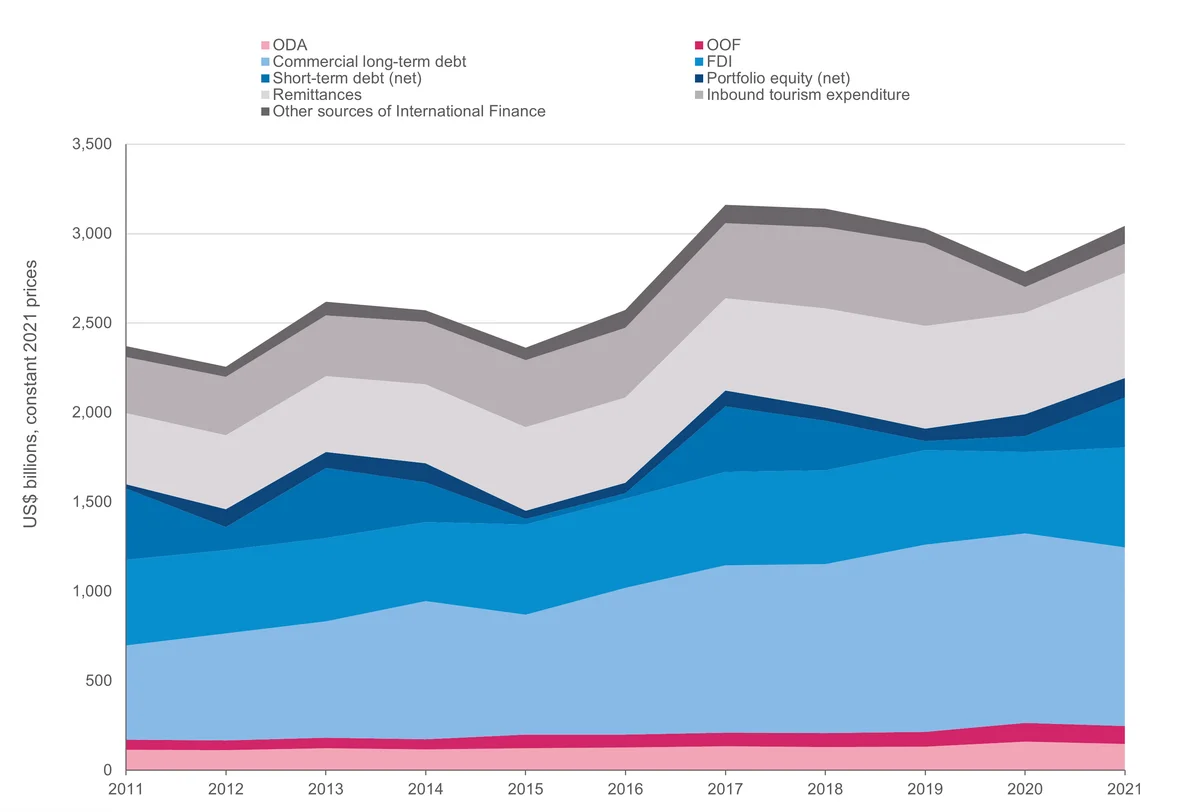
- Commercial long-term debt was consistently the largest annual source of finance between 2011–2021 and was on average six times greater than ODA ( Figure 1 ).
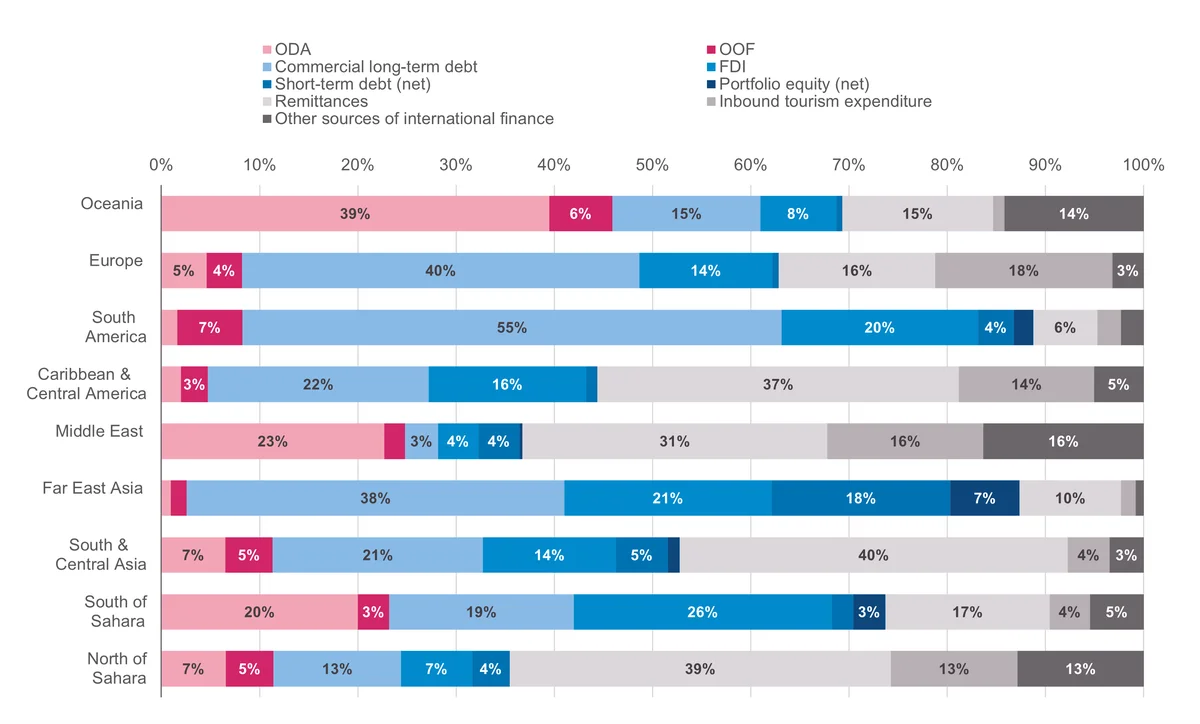
- ODA was an important source of finance to ODA-eligible countries in Oceania and sub-Saharan Africa ( Figure 2 ).
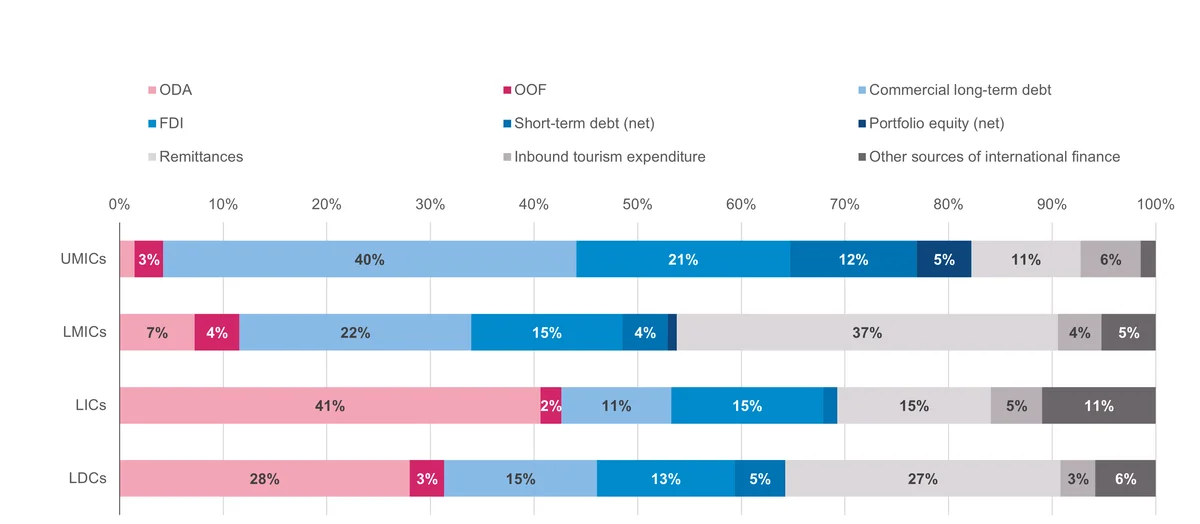
- Remittance inflows were a significant source of finance for lower-middle-income countries, while commercial flows such as commercial long-term debt and foreign direct investment (FDI) were important sources of finance to upper-middle-income countries ( Figure 3 and Figures 4 and 5 within the case study).
- ODA was the largest source of finance to LDCs in 2021, accounting for nearly 30% of their total annual international revenue ( Figure 6 ).
- In 2021, ODA was an importance source of finance to countries classed as ‘extremely fragile’, with remittances also a significant flow to these countries ( Figure 7 , Figure 8 ).
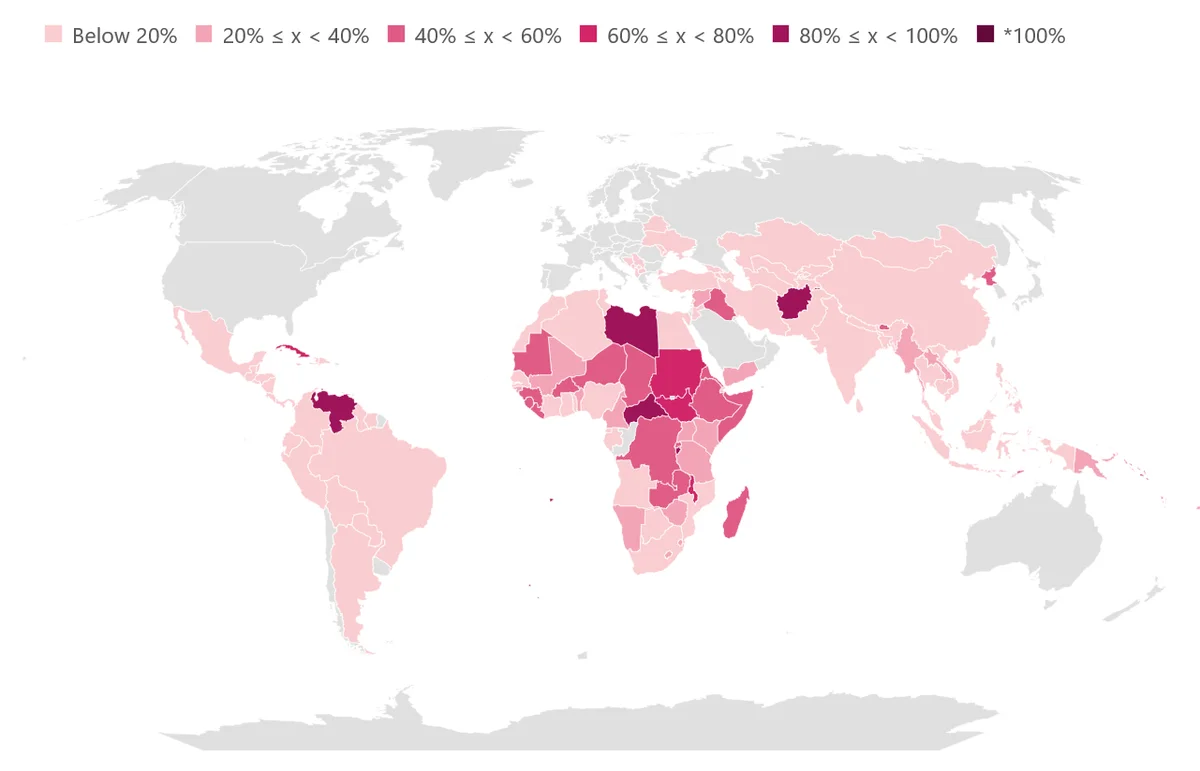
- ODA was the largest source of finance for 30 ODA-eligible countries in 2021 (where data is known), including Afghanistan, Burundi and Central African Republic ( Figure 9 ).
Commercial debt was the largest source of finance between 2011–2021
Figure 1: Commercial long-term debt was consistently the largest annual source of finance between 2011–2021 and was on average six times greater than ODA
Trends in major international financial flows, 2011–2021
| Financial Flow | 2011 | 2012 | 2013 | 2014 | 2015 | 2016 | 2017 | 2018 | 2019 | 2020 | 2021 |
|---|---|---|---|---|---|---|---|---|---|---|---|
| ODA | 113,937,960,000 | 112,956,780,000 | 123,681,850,000 | 117,659,000,000 | 123,128,370,000 | 127,981,820,000 | 134,612,020,000 | 129,232,170,000 | 132,586,100,000 | 159,609,900,000 | 148,169,320,000 |
| Other Official Flows | 56,700,620,000 | 54,322,460,000 | 59,480,810,000 | 56,571,480,000 | 77,129,630,000 | 72,114,020,000 | 74,888,390,000 | 79,403,720,000 | 81,173,340,000 | 105,497,900,000 | 99,600,830,000 |
| Commercial Long-Term Debt | 526,312,825,627 | 596,950,487,528 | 648,826,407,909 | 772,752,681,699 | 668,683,257,511 | 818,790,081,867 | 936,407,856,266 | 943,854,474,542 | 1,048,145,903,030 | 1,060,210,245,212 | 997,871,561,240 |
| FDI | 480,584,975,161 | 467,532,651,335 | 467,011,799,705 | 440,758,847,065 | 504,831,252,740 | 498,440,611,956 | 522,937,527,243 | 524,133,516,629 | 528,111,663,956 | 454,501,962,291 | 559,009,128,156 |
| Short-Term Debt (net) | 396,865,047,796 | 126,712,699,447 | 390,386,435,897 | 221,941,716,089 | 32,074,302,634 | 32,217,215,914 | 365,391,267,412 | 276,497,573,254 | 49,523,360,555 | 88,867,229,092 | 278,595,793,000 |
| Portfolio Equity (net) | 24,945,044,855 | 101,514,296,902 | 89,003,969,425 | 105,636,536,294 | 45,351,052,933 | 58,078,420,526 | 89,778,996,602 | 74,170,579,604 | 69,674,065,398 | 120,854,601,151 | 109,248,342,853 |
| Remittances | 398,542,320,640 | 413,129,330,999 | 424,156,920,909 | 441,787,046,190 | 468,164,847,777 | 475,495,328,191 | 515,790,586,731 | 555,134,223,311 | 574,672,620,236 | 567,934,131,250 | 588,330,266,776 |
| Inbound Tourism Expenditure | 311,581,198,463 | 325,683,363,168 | 341,347,672,603 | 348,750,961,536 | 373,614,768,436 | 389,805,316,982 | 418,059,255,512 | 451,661,190,079 | 461,981,401,067 | 145,330,128,816 | 162,978,334,189 |
| Other sources of International Finance | 61,474,988,311 | 58,131,956,366 | 75,340,291,788 | 65,785,935,429 | 68,729,369,715 | 101,638,891,602 | 103,391,778,733 | 104,725,517,140 | 82,424,132,839 | 84,521,247,878 | 99,203,978,871 |
Source: Development Initiatives based on Organisation for Economic Co-operation and Development (OECD), UN Conference on Trade and Development (UNCTAD), UN World Tourism Organization (UNWTO), World Bank and World Bank-KNOMAD, June 2023.
Notes: FDI = foreign direct investment; ODA = official development assistance; OOF = other official flows. Other sources of international finance consists of: export credits, official long-term debt, development cooperation from other government providers and private development assistance. This chart includes estimates for inbound tourism expenditure for the year 2021. For a definition of each flow, please see the Appendix.
- In 2021, total international flows to (or among) countries which were eligible to receive ODA amounted to US$3 trillion, representing 9% of their total GNI for that year. [4]
- Commercial flows – particularly commercial long-term debt – dominate the international financing landscape. Commercial long-term debt has consistently been the largest source of finance since 2011. In 2021, it amounted to almost US$1 trillion, a third of total international flows in that year. [5] This is despite the fact that over 40% of ODA-eligible countries are currently in debt distress or are at a moderate or higher risk of it. [6]
- ODA from the OECD’s Development Assistance Committee (DAC) donors [7] and multilateral donors to ODA-eligible countries was US$148 billion in 2021, a 7% decrease from US$160 billion in 2020. [8] Commercial long-term debt was five times the value of ODA in 2011, rising to seven times the value of ODA in 2021. Between 2011–2021, commercial long-term debt was on average six times the value of ODA.
- Following commercial long-term debt, remittances and FDI were both important sources of finance, with each consistently either the second or third largest inflow from 2011 onwards.
- 2021 saw an uptick in international financial flows following a marked decline between 2017 and 2020. As expected, 2020 saw a significant decrease when sources of finance such as inbound tourism expenditure and foreign direct investment (FDI) fell due to the Covid-19 pandemic.
- The increase in international financial flows in 2021 was largely due to a rise in FDI, remittances and net short-term debt. [9] FDI increased by 23% between 2020 and 2021 (from US$455 billion to US$559 billion) following a decrease of 14% between 2019 and 2020 when it fell to US$528 billion. At the same time, remittance inflows increased to US$588 billion in 2021 from US$568 billion in 2020.
- Net short-term debt saw the largest increase of all sources of international finance between 2020 and 2021, more than tripling in value from US$89 billion to US$279 billion. [10] Total net short-term debt received in 2021 was concentrated in just a few countries with China accounting for 75% (US$210 billion) while India (US$11 billion) and Brazil (US$10 billion) accounted for approximately 4% each. As Figure 1 shows, net short-term debt fluctuated greatly from one year to the next.
- 2021 saw an increase in several other sources of international finance such as export credits and inbound tourism expenditure. Export credits rose by over 90% between 2020 and 2021, from US$21 billion to US$40 billion. Inbound tourism expenditure decreased significantly in 2020 compared to 2019, falling by 69% from US$462 billion to US$145 billion. It rose to US$163 billion in 2021 but shows no sign of returning to its 2019 value. [11]
International financial flows differ greatly by region
Figure 2: ODA was an important source of finance to ODA-eligible countries in Oceania and sub-Saharan Africa
Major international finance flows by geographic region, 2021
| Financial Flow | North of Sahara | South of Sahara | South & Central Asia | Far East Asia | Middle East | Caribbean & Central America | South America | Europe | Oceania |
|---|---|---|---|---|---|---|---|---|---|
| ODA | 7% | 20% | 7% | 1% | 23% | 2% | 2% | 5% | 39% |
| Other Official Flows | 5% | 3% | 5% | 2% | 2% | 3% | 7% | 4% | 6% |
| Commercial Long-Term Debt | 13% | 19% | 21% | 38% | 3% | 22% | 55% | 40% | 15% |
| FDI | 7% | 26% | 14% | 21% | 4% | 16% | 20% | 14% | 8% |
| Short-Term Debt (net) | 4% | 2% | 5% | 18% | 4% | 1% | 4% | 1% | 1% |
| Portfolio Equity (net) | 0% | 3% | 1% | 7% | 0% | 0% | 2% | 0% | 0% |
| Remittances | 39% | 17% | 40% | 10% | 31% | 37% | 6% | 16% | 15% |
| Inbound Tourism Expenditure | 13% | 4% | 4% | 2% | 16% | 14% | 2% | 18% | 1% |
| Other sources of International Finance | 13% | 5% | 3% | 1% | 16% | 5% | 2% | 3% | 14% |
Source: Development Initiatives based on Organisation for Economic Co-operation and Development (OECD), UN Conference on Trade and Development (UNCTAD), UN World Tourism Organization (UNWTO), World Bank and World Bank-KNOMAD, June 2023.
Notes: FDI = foreign direct investment; ODA = official development assistance; OOF = other official flows. Other sources of international finance consists of: export credits, official long-term debt, development cooperation from other government providers and private development assistance. This chart includes estimates for inbound tourism expenditure for the year 2021. For a definition of each flow, please see the Appendix. The geographic regional categories displayed in this chart follow those listed in the OECD DAC2a table, available at: https://stats.oecd.org/. Only the 142 countries which were eligible to receive ODA in 2021 are included in this chart.
Sources of international finance for ODA-eligible countries varied significantly by geographic region in 2021:
- ODA accounted for almost 40% of all international financial flows to Oceania (US$3.1 billion) in 2021 and was the second largest financial flow to sub-Saharan Africa at 20% in that year (US$59.8 billion).
- Remittances were the largest source of international finance for the Middle East, North of Sahara, South & Central Asia, and Caribbean & Central America regions in 2021, accounting for at least a third of the total international revenue received by each.
- Commercial long-term debt was the most important form of international finance for ODA-eligible countries in Europe, Far East Asia and South America. However, approximately three-quarters of total commercial long-term debt disbursed in 2021 went to just one country in each region: Türkiye in Europe (74% of commercial long-term debt or US$63 billion), China in Far East Asia (76% or US$357 billion) and Brazil in South America (74% or US$152 billion).
- China also accounted for 70% (US$181 billion) of all foreign direct investment (FDI) and 94% (US$210 billion) of all net short-term debt received by the Far East Asia region.
International finance flows differ greatly by income classification
Figure 3: Remittance inflows were a significant source of finance for LMICs, while commercial flows such as commercial long-term debt and FDI were important sources of finance to UMICs
Major international finance flows to ODA-eligible countries and to LDCs, 2021
| Financial Flow | LDCs | LICs | LMICs | UMICs |
|---|---|---|---|---|
| ODA | 28% | 41% | 7% | 1% |
| Other Official Flows | 3% | 2% | 4% | 3% |
| Commercial Long-Term Debt | 15% | 11% | 22% | 40% |
| FDI | 13% | 15% | 15% | 21% |
| Short-Term Debt (net) | 5% | 1% | 4% | 12% |
| Portfolio Equity (net) | 0% | 0% | 1% | 5% |
| Remittances | 27% | 15% | 37% | 11% |
| Inbound Tourism Expenditure | 3% | 5% | 4% | 6% |
| Other sources of International Finance | 6% | 11% | 5% | 1% |
Source: Development Initiatives based on Organisation for Economic Co-operation and Development (OECD), UN Conference on Trade and Development (UNCTAD), UN World Tourism Organization (UNWTO), World Bank and World Bank-KNOMAD, June 2023.
Notes: LDC = least developed country; LIC = low-income country; LMIC = lower-middle-income country; UMIC = upper-middle-income country; ODA = official development assistance; FDI = foreign direct investment; OOF = other official flows. Other sources of international finance consists of: export credits, official long-term debt, development cooperation from other government providers and private development assistance. This chart includes estimates for inbound tourism expenditure for the year 2021. For a definition of each flow, please see the Appendix. World Bank country classification by income level 2022–2023 used (released on 1 July 2022). There is an overlap between countries included in the LDC and LIC categories.
International financial flows to ODA-eligible countries differ greatly when examined in terms of their income groupings. [12]
- Commercial flows such as commercial long-term debt and foreign direct investment (FDI) were significant sources of external finance for upper-middle income countries (UMICs). Commercial long-term debt accounted for 40% of all financial flows received by UMICs in 2021 while FDI accounted for 21%.
- Remittances represented the largest source of international finance for lower-middle income countries (LMICs) at 37%.
- ODA was the most important source of finance for countries in the low-income (LIC) and least-developed (LDC) categories. Although commercial long-term debt, FDI and remittances were important sources of finance, official flows was the most significant type of finance for countries in these categories. For LICs specifically, ODA from DAC countries and multilateral donors (at 41%) along with development cooperation from other government providers (at 8%) accounted for almost half of all international finance received in 2021. [13]
Case Study
Malawi, Kenya and Colombia
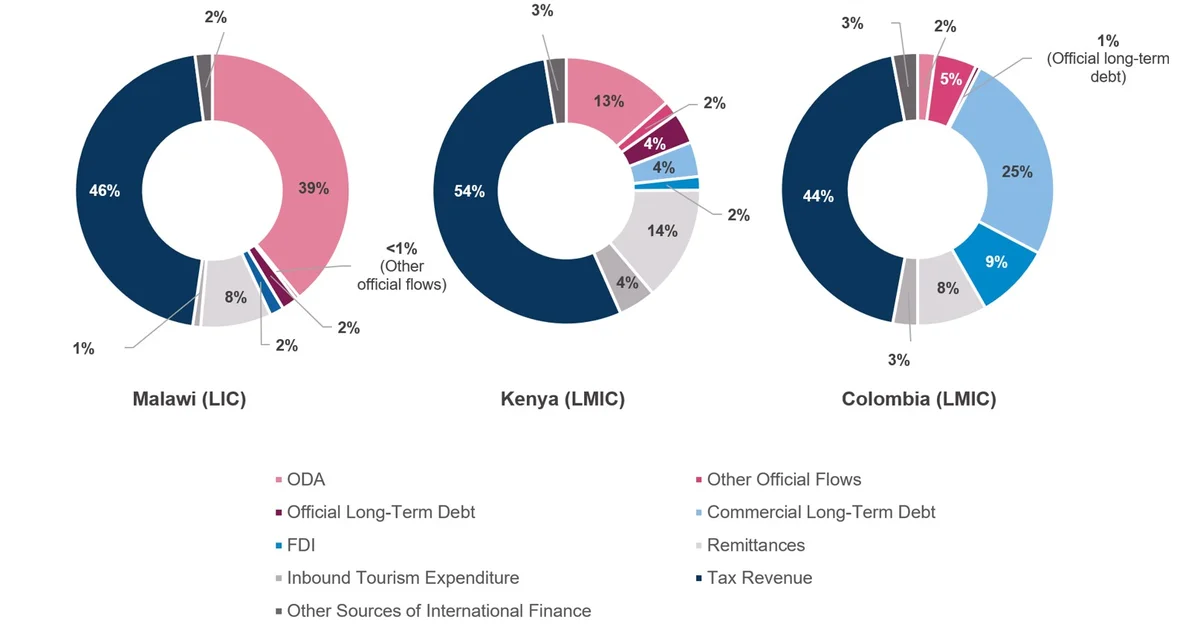
As discussed above in aggregate, international revenue can differ greatly across income groupings. To demonstrate this, here we take a closer look at the financial flows received by Malawi, Kenya and Colombia. Each of these countries has a different World Bank income group classification: Malawi is an LIC, Kenya an LMIC, and Colombia a UMIC. Tax revenue generated by each of the three countries is also discussed in this section alongside the external sources of finance previously discussed in this factsheet.
Figure 4: International revenue sources can vary greatly between different income classifications
Major international financial flows and tax revenue to Malawi, Kenya and Colombia, 2021
| Financial Flow | Malawi | Kenya | Colombia |
|---|---|---|---|
| ODA | 39.1% | 13.5% | 2.1% |
| Other Official Flows | 0.4% | 1.8% | 4.9% |
| Official Long-Term Debt | 1.9% | 3.8% | 0.5% |
| Commercial Long-Term Debt | 0.0% | 4.2% | 25.2% |
| FDI | 1.6% | 1.7% | 9.0% |
| Remittances | 8.3% | 13.9% | 8.3% |
| Inbound Tourism Expenditure | 0.9% | 4.5% | 2.9% |
| Tax Revenue | 45.7% | 54.1% | 44.1% |
| Other Sources of International Finance | 2.0% | 2.6% | 3.0% |
Source: Development Initiatives based on Organisation for Economic Co-operation and Development (OECD); UN Conference on Trade and Development (UNCTAD); UN World Tourism Organization (UNWTO); World Bank; World Bank-KNOMAD, June 2023; International Monetary Fund, World Economic Outlook Database, April 2023.
Notes: ODA = official development assistance; FDI = foreign direct investment. Other sources of international finance consists of: export credits, development cooperation from other government providers, short-term debt (net), portfolio equity (net) and private development assistance. For a definition of each flow, please see the Appendix.
In 2021, Malawi (an LIC) relied much more on ODA as a source of finance than Colombia (a UMIC). The proportion of tax revenue collected in Malawi was similar to the amount of ODA it received from DAC countries and multilateral donors (US$1.4 billion vs US$1.2 billion). [14] Private and commercial international flows accounted for a much lower proportion of the amount of total finance Malawi received when compared with Kenya (an LMIC).
The significance of these different financial flows over time is shown in Figure 5 below. [15] Between 2000 and 2021, ODA was consistently the largest source of finance for Malawi. However by 2021, remittances had become a notable source of finance, accounting for 15% of all international finance received. For Kenya, FDI and inbound tourism expenditure were significant sources of international finance in 2010. Yet by 2021, these forms of revenue had significantly decreased, highlighting the importance of ODA as a source of finance despite Kenya’s graduation from the LIC to the LMIC category in 2014. ODA from DAC donors and multilateral donors to Kenya increased from US$969 million in 2000 to US$2.1 billion in 2010 and then to US$3.65 billion in 2021. Conversely, in Colombia the importance of commercial long-term debt as a source of international finance increased between 2000 and 2021, from a third to nearly a half of all international revenue. [16]
Figure 5: ODA has accounted for a much larger share of Malawi’s external revenue since 2000 when compared to Kenya and Colombia
Major international finance flows to Malawi, Kenya and Colombia in the years 2000, 2010 and 2021
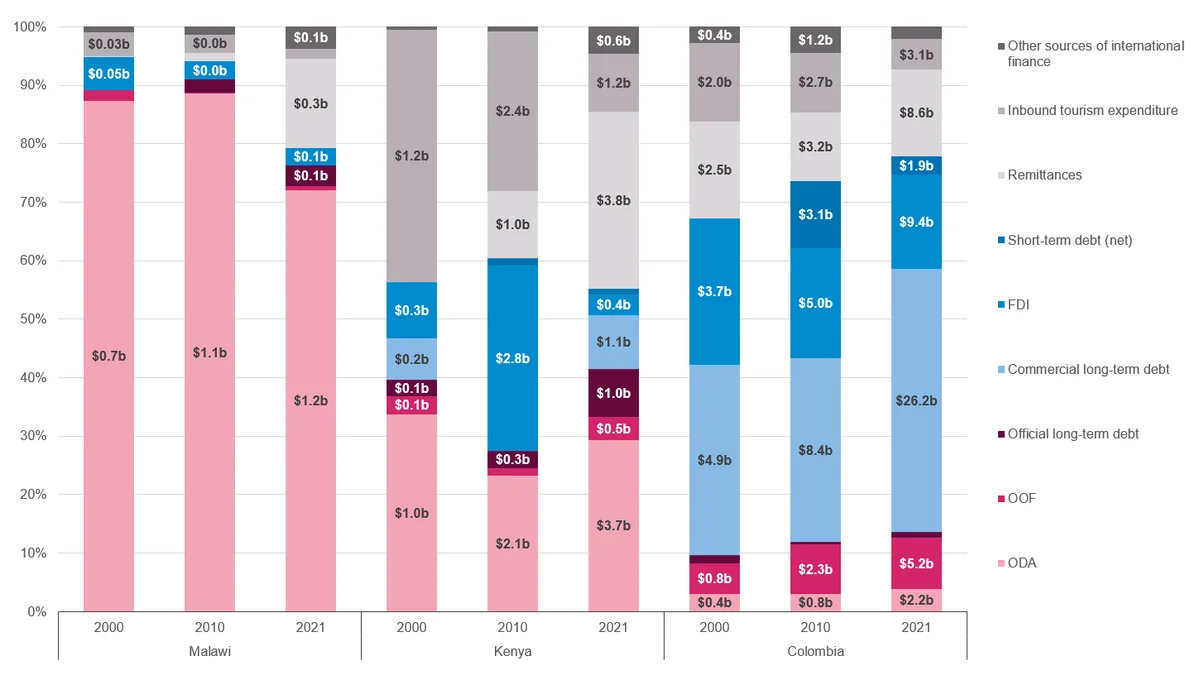
| Country | Year | ODA | OOFs | Official Long-Term Debt | Commercial Long-Term Debt | FDI | Short-Term Debt (net) | Remittances | Inbound Tourism Expenditure | Other Sources of International Finance |
|---|---|---|---|---|---|---|---|---|---|---|
| Malawi | 2000 | 87% | 2% | 0% | 0% | 6% | 0% | 0% | 4% | 1% |
| Malawi | 2010 | 89% | 0% | 2% | 0% | 3% | 0% | 1% | 3% | 1% |
| Malawi | 2021 | 72% | 1% | 3% | 0% | 3% | 0% | 15% | 2% | 4% |
| Kenya | 2000 | 34% | 3% | 3% | 7% | 10% | 0% | 0% | 43% | 0% |
| Kenya | 2010 | 23% | 1% | 3% | 0% | 32% | 1% | 12% | 27% | 1% |
| Kenya | 2021 | 29% | 4% | 8% | 9% | 4% | 1% | 30% | 10% | 5% |
| Colombia | 2000 | 3% | 5% | 1% | 33% | 25% | 0% | 17% | 13% | 3% |
| Colombia | 2010 | 3% | 8% | 0% | 31% | 19% | 11% | 12% | 10% | 4% |
| Colombia | 2021 | 4% | 9% | 1% | 45% | 16% | 3% | 15% | 5% | 2% |
Source: Development Initiatives based on Organisation for Economic Co-operation and Development (OECD); UN Conference on Trade and Development (UNCTAD); UN World Tourism Organization (UNWTO); World Bank; World Bank-KNOMAD, June 2023.
Notes: Only Malawi has consistently stayed in the low-income (LIC) group between 2000–2021. Colombia moved from the lower-middle-income (LMIC) group to the upper-middle-income (UMIC) group in 2008, and Kenya moved from the LIC group to the LMIC group in 2014. ODA = official development assistance; FDI = foreign direct investment; OOF = other official flows. Other sources of international finance consists of: export credits, development cooperation from other government providers, portfolio equity (net) and private development assistance.
ODA was the largest source of finance for LDCs in 2021
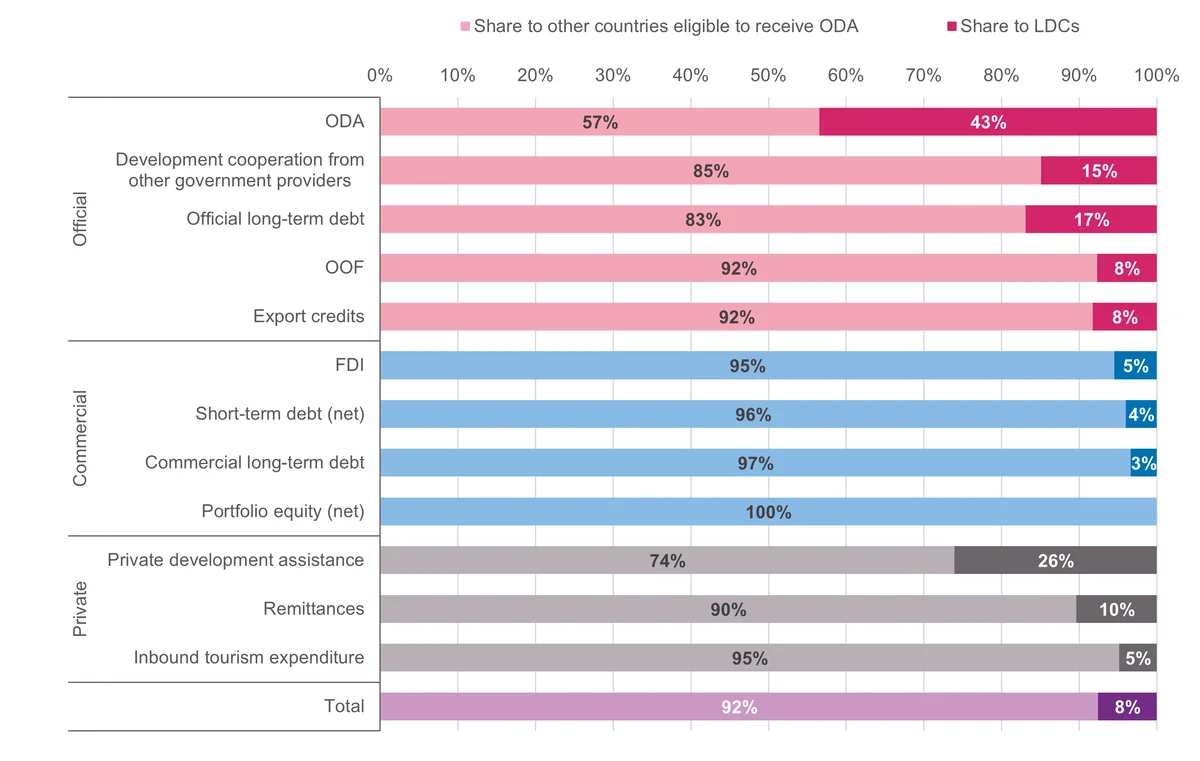
Figure 6: Least developed countries (LDCs) received only a small proportion of commercial and private financial flows in 2021
Share of international financial flows to LDCs, 2021
| Financial Flow | % Share to LDCs | % Share to other countries eligible to receive ODA |
|---|---|---|
| Inbound Tourism Expenditure | 5% | 95% |
| Remittances | 10% | 90% |
| Private Development Assistance | 26% | 74% |
| Portfolio Equity (net) | 0% | 100% |
| Commercial Long-Term Debt | 3% | 97% |
| Short-Term Debt (net) | 4% | 96% |
| FDI | 5% | 95% |
| Export Credits | 8% | 92% |
| Other Official Flows | 8% | 92% |
| Official Long-Term Debt | 17% | 83% |
|
Development Cooperation from
other Government Providers |
15% | 85% |
| ODA | 43% | 57% |
Source: Development Initiatives based on Organisation for Economic Co-operation and Development (OECD); UN Conference on Trade and Development (UNCTAD); UN World Tourism Organization (UNWTO); World Bank; World Bank-KNOMAD, June 2023.
Notes: FDI = foreign direct investment; ODA = official development assistance; OOF = other official flows. The darker portion of each stacked bar indicates the share of international finance to ODA-eligible countries allocated to LDCs.
In 2021, only a small proportion of the commercial and private flows analysed went to least-developed countries (LDCs). In the same year, only 5% of all foreign direct investment (FDI) to ODA-eligible countries went to LDCs while only 10% of remittances went to LDCs. [17]
- ODA was the largest source of financing to LDCs in 2021, representing 29% of total international finance received. 43% of ODA disbursements from DAC countries and multilateral donors (US$64 billion out of a total US$148 billion) went to LDCs.
- 26% of all private development assistance provided in 2021 to ODA-eligible countries went to LDCs, totalling US$1.2 billion. [18]
Extremely fragile countries were more reliant on ODA than others
Types of international finance received also vary greatly depending on whether a country has been designated as fragile or not. ‘Fragility’ is defined by the OECD’s States of Fragility platform as the “combination of exposure to risk and insufficient coping capacities of the state, system and/or communities to manage, absorb or mitigate those risks” and is measured across the following six dimensions: economic, environmental, human, political, security and societal. [19]
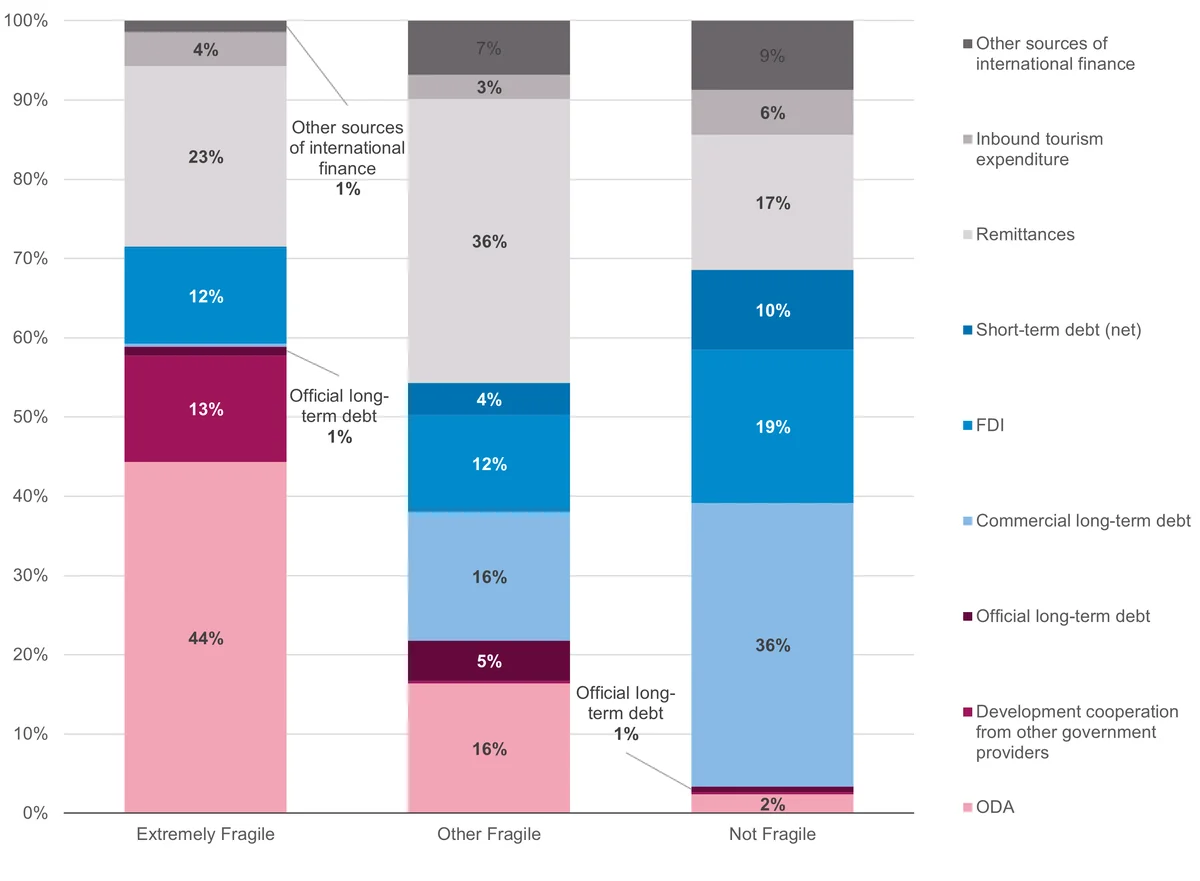
Figure 7: ODA was an important source of finance to extremely fragile countries in 2021
Major international finance flows based on fragility level, 2021
| Fragility level | ODA | Development Cooperation from other Government Providers | Official Long-Term Debt | Commercial Long-Term Debt | FDI | Short-Term Debt (net) | Remittances | Inbound Tourism Expenditure | Other sources of International Finance |
|---|---|---|---|---|---|---|---|---|---|
| Extremely Fragile | 44% | 13% | 1% | 0% | 12% | 0% | 23% | 4% | 1% |
| Other Fragile | 16% | 0% | 5% | 16% | 12% | 4% | 36% | 3% | 7% |
| Not Fragile | 2% | 0% | 1% | 36% | 19% | 10% | 17% | 6% | 9% |
Source: Country level fragility classification data is from: OECD (2022), States of Fragility 2022, OECD Publishing, Paris, https://doi.org/10.1787/c7fedf5e-en. Development Initiatives based on Organisation for Economic Co-operation and Development (OECD); UN Conference on Trade and Development (UNCTAD); UN World Tourism Organization (UNWTO); World Bank; World Bank-KNOMAD, June 2023.
Notes: FDI = foreign direct investment; ODA = official development assistance. Other sources of international finance consists of: export credits, other official flows, portfolio equity (net), private development assistance. This chart includes estimates for inbound tourism expenditure for the year 2021. For a definition of each flow, please see the Appendix. Countries which were classed as ‘extremely fragile’ in 2022 were much more reliant on ODA or development cooperation from other government providers as a source of finance in 2021 than countries which were less fragile or unclassified.
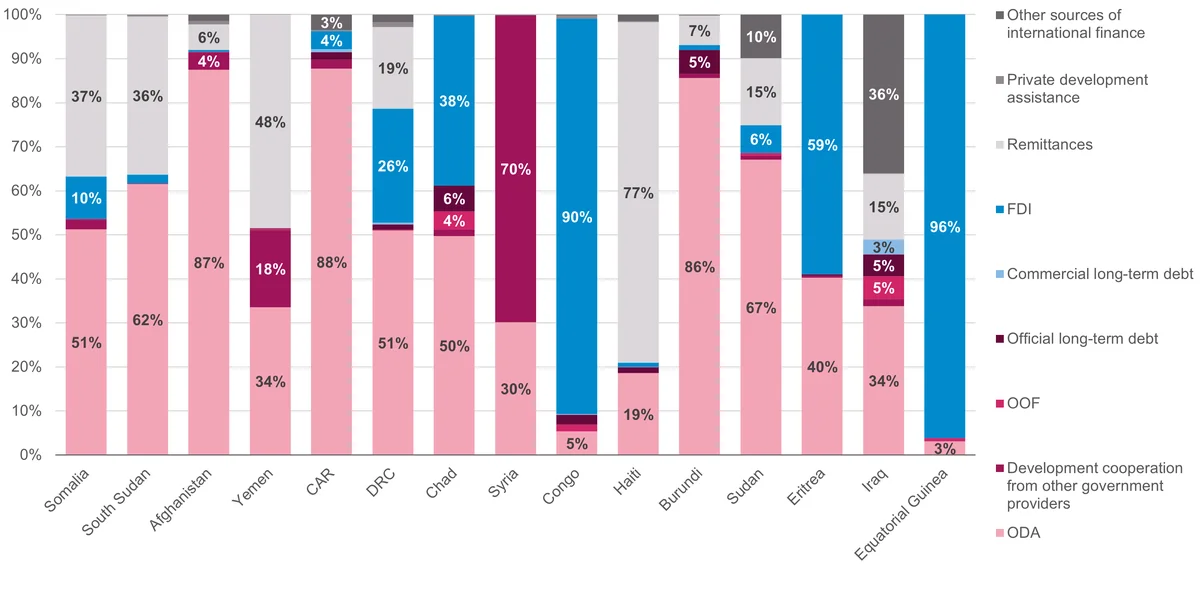
- ODA was the largest source of finance in 2021 for seven of the 15 countries classified as ‘extremely fragile’. These included the Democratic Republic of the Congo, Somalia, Sudan, South Sudan, Afghanistan, Burundi and Central African Republic. Further details are provided in Figure 8.
- Following on from this, remittances were the second most significant financial flow in 2021.
Figure 8: ODA was the largest source of finance for nearly half of the countries classified as extremely fragile in 2021
Major international finance flows to extremely fragile countries, 2021
| Country | ODA | Development Cooperation from other Government Providers | Other Official Flows | Official Long-Term Debt | Commercial Long-Term Debt | FDI | Remittances | Private Development Assistance | Other sources of International Finance |
|---|---|---|---|---|---|---|---|---|---|
| Somalia | 51% | 2% | 0% | 0% | 0% | 10% | 37% | 0% | 0% |
| South Sudan | 62% | 0% | 0% | 0% | 0% | 2% | 36% | 0% | 0% |
| Afghanistan | 87% | 4% | 0% | 0% | 0% | 0% | 6% | 1% | 1% |
| Yemen | 34% | 18% | 0% | 0% | 0% | 0% | 48% | 0% | 0% |
| Central African Republic | 88% | 2% | 0% | 2% | 1% | 4% | 0% | 0% | 3% |
| Democratic Republic of the Congo | 51% | 0% | 0% | 1% | 0% | 26% | 19% | 1% | 2% |
| Chad | 50% | 1% | 4% | 6% | 0% | 38% | 0% | 0% | 0% |
| Syria | 30% | 70% | 0% | 0% | 0% | 0% | 0% | 0% | 0% |
| Congo | 5% | 0% | 2% | 2% | 0% | 90% | 0% | 1% | 0% |
| Haiti | 19% | 0% | 0% | 1% | 0% | 1% | 77% | 0% | 1% |
| Burundi | 86% | 1% | 0% | 5% | 0% | 1% | 7% | 0% | 0% |
| Sudan | 67% | 1% | 1% | 0% | 0% | 6% | 15% | 0% | 10% |
| Eritrea | 40% | 0% | 0% | 0% | 0% | 59% | 0% | 0% | 0% |
| Iraq | 34% | 2% | 5% | 5% | 3% | 0% | 15% | 0% | 36% |
| Equatorial Guinea | 3% | 0% | 1% | 0% | 0% | 96% | 0% | 0% | 0% |
Source: Country-level fragility classification data is from: OECD (2022), States of Fragility 2022, OECD Publishing, Paris, https://doi.org/10.1787/c7fedf5e-en. Development Initiatives based on Organisation for Economic Co-operation and Development (OECD); UN Conference on Trade and Development (UNCTAD); UN World Tourism Organization (UNWTO); World Bank; World Bank-KNOMAD, June 2023.
Notes: CAR = Central African Republic; DRC = Democratic Republic of the Congo; FDI = foreign direct investment; ODA = official development assistance; OOF = other official flows. Other sources of international finance consists of: export credits, portfolio equity (net), short-term debt (net), inbound tourism expenditure. This chart includes estimates for inbound tourism expenditure for the year 2021. Countries are shown in order of fragility, from most (Somalia) to least (Equatorial Guinea) fragile. For a definition of each flow, please see the Appendix.
ODA was the largest source of finance for 30 ODA-eligible countries in 2021 (where data is known)
Figure 9: ODA accounted for at least 50% of the external finance received by 30 ODA-eligible countries in 2021
Map showing ODA as a % of total external finance received by each ODA-eligible country, 2021
| Country | ODA as a % of total external finance | |
|---|---|---|
| Albania | 9% | |
| Benin | 25% | |
| Bhutan | 52% | |
| Cuba | 72% | |
| Afghanistan | 89% | |
| Algeria | 7% | |
| Angola | 4% | |
| Antigua and Barbuda | 1% | |
| Argentina | 1% | |
| Armenia | 6% | |
| Azerbaijan | 5% | |
| Bangladesh | 13% | |
| Belarus | 3% | |
| Belize | 7% | |
| Bolivia | 15% | |
| Bosnia and Herzegovina | 13% | |
| Botswana | 12% | |
| Brazil | 1% | |
| Burkina Faso | 49% | |
| Burundi | 86% | |
| Cambodia | 13% | |
| Cameroon | 28% | |
| Cabo Verde | 21% | |
| Central African Republic | 88% | |
| Chad | 50% | |
| China (People's Republic of) | 0% | |
| Colombia | 4% | |
| Comoros | 22% | |
| Democratic Republic of the Congo | 52% | |
| Congo | 5% | |
| Costa Rica | 2% | |
| Côte d'Ivoire | 18% | |
| Djibouti | 16% | |
| Dominica | 30% | |
| Dominican Republic | 2% | |
| Ecuador | 3% | |
| Egypt | 5% | |
| El Salvador | 2% | |
| Equatorial Guinea | 3% | |
| Eritrea | 40% | |
| Ethiopia | 41% | |
| Fiji | 35% | |
| Gabon | 5% | |
| Gambia | 20% | |
| Georgia | 9% | |
| Ghana | 10% | |
| Grenada | 13% | |
| Guatemala | 2% | |
| Guinea | 41% | |
| Guinea-Bissau | 31% | |
| Guyana | 8% | |
| Haiti | 19% | |
| Honduras | 7% | |
| India | 3% | |
| Indonesia | 3% | |
| Iran | 12% | |
| Iraq | 50% | |
| Jamaica | 1% | |
| Jordan | 19% | |
| Kazakhstan | 0% | |
| Kenya | 29% | |
| Kiribati | 83% | |
| Democratic People's Republic of Korea | 55% | |
| Kosovo | 16% | |
| Kyrgyzstan | 12% | |
| Lao People's Democratic Republic | 27% | |
| Lebanon | 16% | |
| Lesotho | 26% | |
| Liberia | 52% | |
| Libya | 95% | |
| Former Yugoslav Republic of Macedonia | 11% | |
| Madagascar | 57% | |
| Malawi | 72% | |
| Malaysia | 1% | |
| Maldives | 3% | |
| Mali | 38% | |
| Marshall Islands | 74% | |
| Mauritania | 53% | |
| Mauritius | 3% | |
| Mexico | 0% | |
| Micronesia | 85% | |
| Moldova | 12% | |
| Mongolia | 5% | |
| Montenegro | 6% | |
| Montserrat | 94% | |
| Morocco | 8% | |
| Mozambique | 13% | |
| Myanmar | 26% | |
| Namibia | 23% | |
| Nauru | 100% | |
| Nepal | 17% | |
| Nicaragua | 13% | |
| Niger | 58% | |
| Nigeria | 10% | |
| Niue | 100% | |
| Pakistan | 7% | |
| Palau | 57% | |
| Panama | 1% | |
| Papua New Guinea | 32% | |
| Paraguay | 7% | |
| Peru | 2% | |
| Philippines | 3% | |
| Rwanda | 44% | |
| Samoa | 27% | |
| Sao Tome and Principe | 43% | |
| Senegal | 11% | |
| Serbia | 4% | |
| Sierra Leone | 58% | |
| Solomon Islands | 68% | |
| Somalia | 51% | |
| South Africa | 3% | |
| South Sudan | 62% | |
| Sri Lanka | 8% | |
| Saint Helena | 100% | |
| Saint Lucia | 9% | |
| Saint Vincent and the Grenadines | 39% | |
| Sudan | 74% | |
| Suriname | 13% | |
| Eswatini | 26% | |
| Syrian Arab Republic | 30% | |
| Tajikistan | 14% | |
| Tanzania | 37% | |
| Thailand | 1% | |
| Timor-Leste | 48% | |
| Togo | 17% | |
| Tokelau | 100% | |
| Tonga | 34% | |
| Tunisia | 17% | |
| Turkey | 3% | |
| Turkmenistan | 1% | |
| Tuvalu | 93% | |
| Uganda | 37% | |
| Ukraine | 6% | |
| Uzbekistan | 5% | |
| Vanuatu | 40% | |
| Venezuela | 88% | |
| Viet Nam | 4% | |
| Wallis and Futuna | 100% | |
| West Bank and Gaza Strip | 27% | |
| Yemen | 34% | |
| Zambia | 42% | |
| Zimbabwe | 22% |
Source: Development Initiatives based on Organisation for Economic Co-operation and Development (OECD); UN Conference on Trade and Development (UNCTAD); UN World Tourism Organization (UNWTO); World Bank; World Bank-KNOMAD, June 2023.
Notes: Country borders do not necessarily reflect Development Initiatives' position. Data is not available for all financial flows analysed for all ODA-eligible countries; details of data coverage is available in the accompanying dataset. *Countries with a value of 100% only have ODA data available.
As mentioned previously, ODA was a significant source of finance for some countries in 2021, particularly least-developed countries (LDCs) and those classified by the OECD’s States of Fragility platform as ‘extremely fragile’. [20] In 2021, ODA from DAC countries and multilateral donors accounted for over half of all known international finance received by 30 ODA-eligible countries during that year. [21] Examples of LDCs – which are also classified as extremely fragile – for which ODA was a significant source of finance include:
- Afghanistan: the country received US$4.5 billion of ODA in 2021 which represented 89% of total international finance received. [22] Afghanistan’s next greatest source of finance in 2021 was remittance inflows at US$300 million.
- Burundi: received US$620 million of ODA in 2021, equal to 86% of total international finance received. [23] Like Afghanistan, remittances were Burundi’s next largest source of finance in 2021 at US$48 million.
- Central African Republic (CAR): received US$648 million of ODA (88% of international finance received). [24] The next greatest financial flow to CAR in 2021 was foreign direct investment (FDI) at US$30 million.
Appendix: International financial flow details
| Flow type | Flow name | Data source | Date of data download | Flow details |
|---|---|---|---|---|
| Official | Official development assistance (ODA) | OECD (DAC2a) | May 2023 | Resource flows to countries and territories on the DAC List of ODA Recipients and to multilateral agencies which are: (a) undertaken by the official sector; (b) with promotion of economic development and welfare as the main objective; (c) at concessional financial terms. In addition to financial flows, technical co-operation is included in aid. Grants, loans and credits for military purposes and transactions that have primarily commercial objectives are excluded. |
| Official | Other official flows (OOF) | OECD (DAC2b) | May 2023 | Transactions by the official sector with countries on the DAC List of ODA Recipients which do not meet the conditions for eligibility as Official Development Assistance, either because they are not primarily aimed at development, or because they have a grant element of less than 25%. |
| Official | Export credits | OECD (DAC2b) | May 2023 | Export credits are government financial support, direct financing, guarantees, insurance or interest rate support provided to foreign buyers to assist with the purchasing of goods from national exporters. |
| Official | Official long-term debt | World Bank, International Debt Statistics dataset | December 2022 | Data is based on multiple indicators sourced from the World Bank International Debt Statistics dataset. Official long-term debt refers to public and publicly guaranteed debt from official creditors, including loans from both international organisations (multilateral loans) and government (bilateral loans). Data on ODA loans and OOF loans as reported to the OECD DAC database is subtracted to avoid double counting. Negatives are set to zero at the country level. |
| Commercial | Commercial long-term debt | World Bank, International Debt Statistics dataset | December 2022 |
Data is based on multiple indicators sourced from the World Bank International Debt Statistics dataset. It refers to lending by commercial actors and includes private loans that are public and publicly guaranteed
(PPG) – bonds, commercial banks and other private – and private non-guaranteed (PNG) loans – bonds and commercial banks. Private non-guaranteed external debt is an external obligation of a private debtor that is not guaranteed for repayment by a public entity. Public and publicly guaranteed debt from private creditors includes: bonds that are either publicly issued or privately placed; commercial bank loans from private banks and other private financial institutions; other private credits from manufacturers, exporters, and other suppliers of goods; and bank credits covered by a guarantee of an export credit agency. |
| Commercial | Net short-term debt | World Bank, International Debt Statistics dataset | December 2022 | Net flows (or net lending or net disbursements) received by the borrower during the year are disbursements minus principal repayments. Short-term external debt is defined as debt that has an original maturity of one year or less. |
| Commercial | Foreign direct investment (FDI) | UNCTAD | May 2023 | Foreign direct investment is an investment made by a resident enterprise in one economy (direct investor or parent enterprise) with the objective of establishing a lasting interest in an enterprise that is resident in another economy (direct investment enterprise or foreign affiliate). |
| Commercial | Net portfolio equity | World Bank | April 2023 | Portfolio equity covers net inflows from equity securities other than those recorded as direct investment and including shares, stocks, depository receipts (American or global), and direct purchases of shares in local stock markets by foreign investors. Data is taken from the World Bank World Development Indicator 'Portfolio equity, net inflows (BoP, current US$)'. If data is unavailable then data is taken from the World Bank International Debt Statistics dataset indicator 'Portfolio investment, equity (DRS, current US$)'. |
| Private |
Remittance
inflows (gross) |
World Bank-KNOMAD, June 2023 | June 2023 |
Remittance inflows are compiled in the following way: “where data is available, remittances are measured as the sum of two items in the International Monetary Fund’s Balance of Payments Statistics Year Book: (i) personal transfers, and (ii) compensation of employees […] Compensation of employees refers to ‘the income of border, seasonal, and other short-term workers who are employed in an economy where they are not resident and of residents employed by non-resident entities.” Personal transfers consist of “all current transfers in cash or in kind made or received by resident households to or from non-resident households. […] For some countries, data is obtained from the respective country’s Central Bank and other relevant official sources.” Additional
details are available at: https://www.knomad.org/data/faqs |
| Private | Inbound tourism expenditure | UNWTO | June 2023 | “Inbound tourism comprises the activities of a non-resident visitor within the country of reference on an inbound tourism trip”. Methodological Notes to the Tourism Statistics Database, 2023 Edition. We use Passenger Transport and Travel from the UNWTO Expenditure dataset to define tourism expenditure. |
| Private | Private development assistance | OECD (CRS) | May 2023 | Private development finance refers to grants made by private philanthropic foundations, NGOs and other civil society organisations. |
Downloads
Notes
-
1
Throughout this factsheet, unless otherwise specified, the countries analysed are the 142 countries on the OECD ‘DAC List of ODA Recipients: Effective for reporting on 2021 flows’ which are available at: https://www.oecd.org/dac/financing-sustainable-development/development-finance-standards/DAC-List-of-ODA-Recipients-for-reporting-2021-flows.pdf Please note that most of this factsheet focuses predominately on international flows rather than domestic revenue.Return to source text
-
2
Development Initiatives (2023), ‘How much aid actually reaches the countries with the greatest poverty? Facts and principles of ODA allocation’. /resources/how-much-aid-reaches-countries-with-greatest-poverty/Return to source text
-
3
Least Developed Countries (LDCs) are 46 low-income countries which are designated by the UN as “confronting severe structural impediments to sustainable development […] highly vulnerable to economic and environmental shocks and have low levels of human assets.” For additional information on LDCs, see: https://www.un.org/development/desa/dpad/least-developed-country-category.htmlReturn to source text
-
4
World Bank Data, 'GNI (current US$)' ID: NY.GNP.MKTP.CD . Available at: https://data.worldbank.org/indicator/NY.GNP.MKTP.CDReturn to source text
-
5
It must be noted that China received US$357 billion or 36% of the almost US$1 trillion commercial long-term debt value cited.Return to source text
Related content
Kenya’s aid information management: The data landscape
An examination of Kenya's platforms for monitoring and managing aid-funded projects and programmes, with recommendations for integrations and improvements.
National factors helping aid-funded programmes deliver: Kenya, Uganda, Ethiopia
Results from case studies on social protection, agriculture and health, programmes receiving ODA in Kenya, Uganda and Ethiopia
ODA financing the climate–gender–disability interface: Key facts
Donors and African domestic budget allocators must consider the impact of climate change on women and girls with disabilities when making financing decisions