-
ODA to the poorest countries is growing at the slowest rate
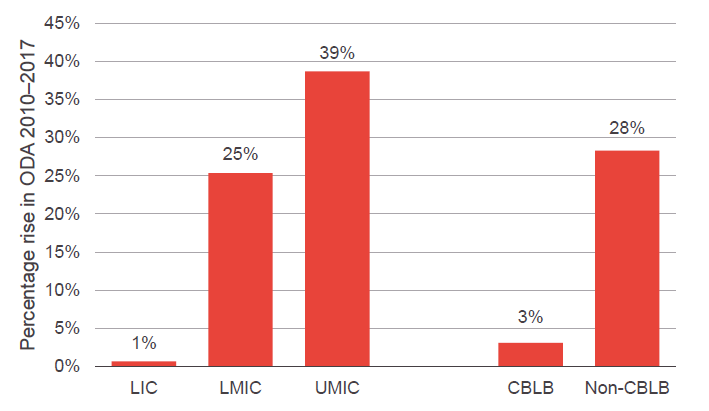
Figure 1: ODA rising more slowly in LICs and countries at risk of being left behind, 2010–2017
Source: Development Initiatives based on OECD DAC data.
Notes: CBLB: countries at risk of being left behind; LIC: low-income countries; LMIC: lower middle-income countries; UMIC: upper middle-income countries.
- Low-income countries (LICs) saw the smallest rises compared to lower middle-income countries (LMICs – 18% growth) and upper middle-income countries (UMICs – 40% growth). ODA to LICs increased by just 1% – it actually declined by 5% between 2010 and 2016, then rose 6% in 2017. Yet LICs were the only income group to see the proportion of global poverty rise between 2010–2015. Proportions fell in LMICs and UMICs.
- Large rises in aid to particular countries affect these overall trends. ODA to UMIC Turkey, for example, increased by US$3.3 billion, a rise of 273%. ODA rose in 18 of the 31 LICs, but some experienced significant falls.
- Countries most at risk of being left behind (CBLBs) also experienced very slow aid growth – just 3% – while ODA to other countries rose by 28%. Many have not benefited at all from overall increases to aid. ODA fell in 11 out of 30 CBLBs.
- Aid to LDCs fell by 1% between 2010 and 2016 before rising by 11% in 2017 to stand at 10% higher than in 2010 – a much slower rate of increase than LMICs or UMICs.
This slow rise in aid to the poorest countries is especially concerning in light of the fact that these countries are home to an increasing proportion of the world’s poor. In 2010, 24% of people living in absolute poverty lived in LICs. By 2015 this had risen to 38%. ODA needs to be refocused to the places it is needed most to close the widening gap between the poorest people and places and the rest of the world – in practical terms, this means accelerating ODA growth to the poorest countries.
-
The poorest countries are receiving more loans at the expense of critical grants
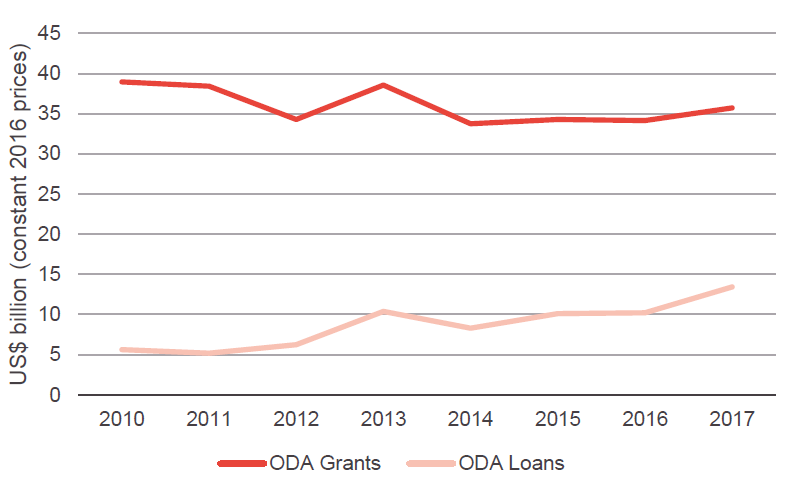
Figure 2: In LDCs grants are lower than in 2010 while loans have more than doubled
Source: Development Initiatives based on OECD DAC data.
- ODA to LDCs flatlined between 2010–2016 before rising by US$4.8 billion in 2017. Loans accounted for US$3.2 billion – two-thirds – of this rise. Loans also accounted for over 40% of the US$3.6 billion rise in ODA to CBLBs.
- Longer-term trends also show loans rising – loans to LDCs grew by 138%.
- Meanwhile grants to LDCs are falling – they were 8% lower in 2017 than in 2010. Yet grants to wealthier LMICs and UMICs were up by 2% and 20% respectively.
- In 2017 a quarter of loans to LDCs went to countries either at high risk of debt distress, or actually in debt distress.
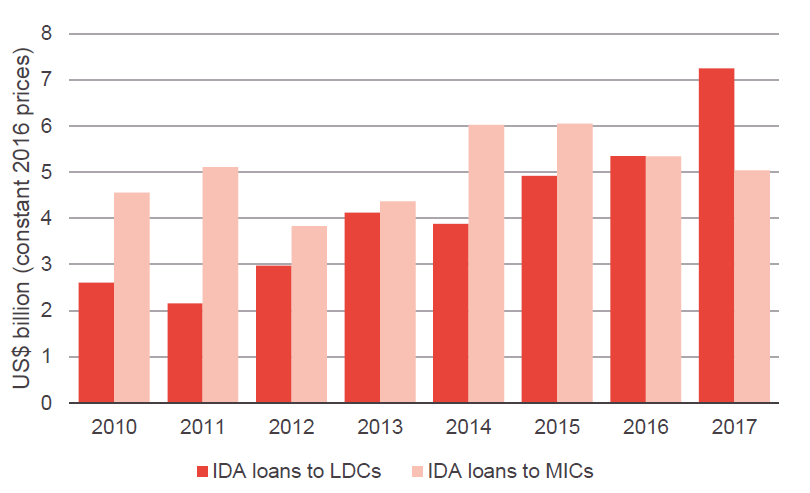
- A number of both bilateral and multilateral donors are driving these trends. The International Development Association (IDA), for example, has cut its grant funding to LDCs by over US$1 billion, from US$1.7 billion to just under US$700 million since 2010. Meanwhile, its lending to LDCs increased by US$4.6 billion – most notably to Bangladesh (up by US$1 billion), Ethiopia (up by US$713 million) and Yemen, which despite ongoing conflict, received US$533 million in IDA loans in 2017, an increase of US$464 million compared to 2010.
- The destination of IDA lending has also shifted. In 2010, IDA gave almost US$2 billion more in loans to MICs than to LDCs, whereas in 2017 it gave over US$2 billion more in loans to LDCs than to MICs.
- Bilateral donors have also had a role in driving this change. France, for example, has reduced its grant funding to LDCs by US$660 million while increasing its lending to LDCs by over US$430 million since 2010.
- Among the DAC members who give little or no loan funding to LDCs, four donors – Netherlands, Spain, Belgium and Canada – each cut their grants to LDCs by more than US$0.5 billion.
Figure 3: IDA has moved away from lending to MICs in favour of LDCs
Source: Development Initiatives based on OECD DAC data.
Notes: IDA: International Development Association; LDCs: least developed countries; MICs: middle-income countries.
The rise in ODA loans to the poorest and most vulnerable countries is concerning as they are the places where concessional resources are most needed and have the most impact. They are also the places with high vulnerability to debt distress. Those donors replacing grants with loans, particularly in LDCs, should reconsider and assess whether loans are the right instrument in the absence of growing grant funding.
-
ODA to key sectors is lagging behind
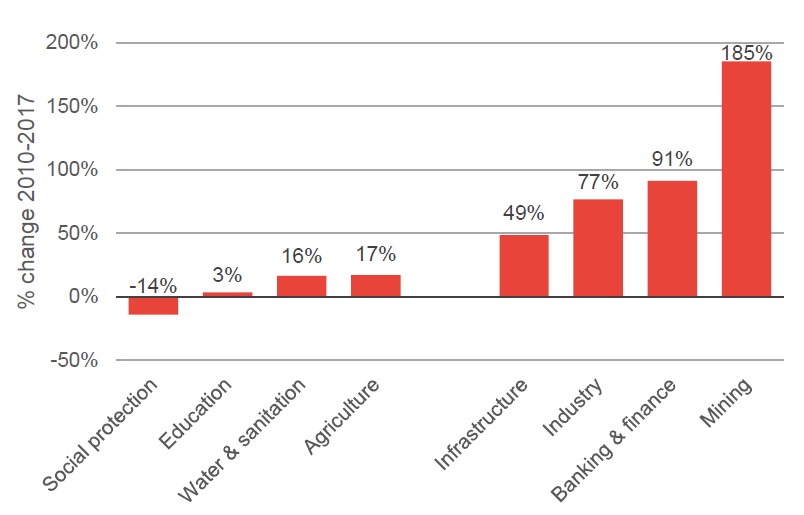
Figure 4: Rise in ODA to social sectors and agriculture is far lower than in infrastructure and productive sectors
Source: Development Initiatives based on OECD DAC data.
- Across the above sectors, growth in loans outstripped growth in grant funding. Grant funding fell sharply for social protection (–52%) and water & sanitation (–11%) in particular. Additional loans accounted for the majority of the increase in infrastructure, business and industry-related sectors.
- The destination of sector investments is not always in line with need. For example, donors spent a lower proportion of ODA on education in the poorest countries – 7% of total ODA to LDCs in 2017, but 11% in UMICs.
- Conversely, the reported fall in ODA to social protection was concentrated in middle-income countries (MICs), whereas it grew by 77% in LDCs. At $1.2bn, however, volumes remain small in these countries compared to other sectors such as health (US$9.9 billion), infrastructure (US$6.9 billion) and humanitarian aid (US$8.1 billion).
Declining or slow growth in critical human capital sectors – sectors that are both critical to human welfare and development and to economic development – risks undermining commitments to social welfare in the SDGs and future economic growth and independence. Strengthening investments in foundational sectors such as education and social protection is at the core of a smart, long-term aid strategy.
-
Less assistance is going through local actors in poorer countries
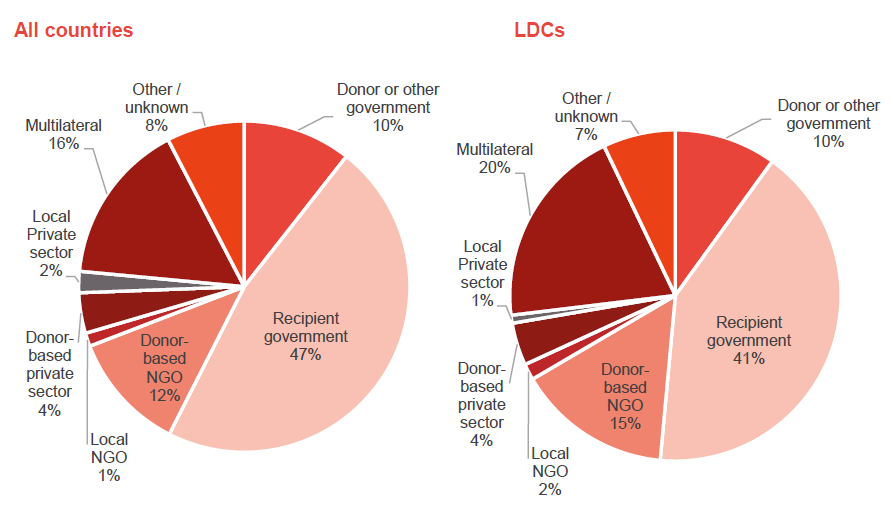
Figure 5: Local NGOs and private sector are rarely used as first implementation partners by donors
Source: Development Initiatives based on OECD DAC data.
- Donors are less likely to use recipient government agencies in LDCs.
- Aid delivered as general budget support has fallen by a third since 2010. For LDCs it has more than halved (54%), falling US$1.7 billion.
- Only a tenth of ODA channelled through NGOs went first via local NGOs in 2017 and only one-third of ODA through private-sector bodies used local actors.
- In poorer countries, less use is made of local actors, including government bodies. In LDCs 44% was channelled through local actors – 41% through recipient governments; 1% though local private sector actors; and 2% through local NGOs.
- UN OCHA’s Financial Tracking System shows that in 2017, just 2.9% of total humanitarian assistance went directly to local and national responders. Of this, 84% was directed to national governments, and local and national NGOs received just 0.4% of the total.
Capacity building, system strengthening, enabling environments and other important secondary benefits can all be the results of working with local organisations and companies – while this is inherently more challenging in some contexts such as the poorest or more fragile countries, it is equally where the benefit can be greatest. Strengthening partnerships with local delivery partners is one critical way donors can support this.
-
Increased aid to short-term priorities
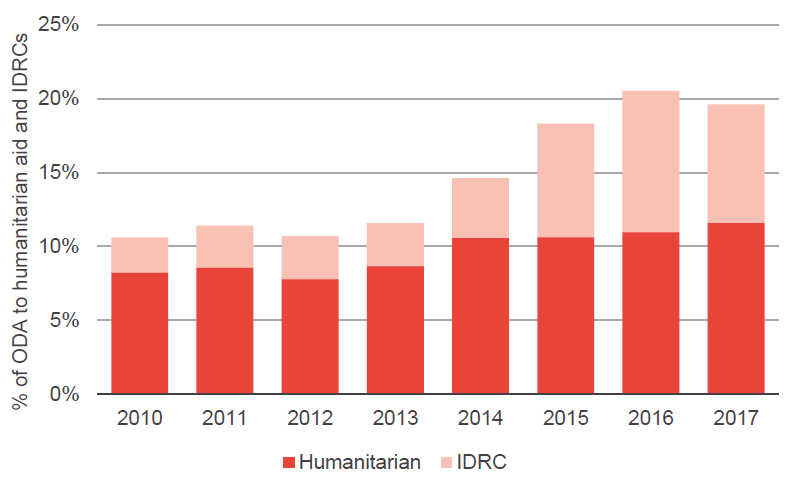
Figure 6: Around one-fifth of all ODA is now spent on short-term interventions rather than longer-term development priorities
Source: Development Initiatives based on OECD DAC data.
Note: IDRC: in-donor refugee costs.
- In dollar terms, aid to short-term interventions in crisis situations and on in-donor refugee costs (IDRCs) rose by 134%, while other forms of ODA rose by just 14%. The largest single factor was the increase in IDRCs where more than four times as much ODA was spent in 2017 than in 2010.
- This rapid rise means that the proportion of ODA spent on such short-term interventions has almost doubled since 2010.
- ODA spent on IDRCs is particularly high in some countries. It now comprises over half of Italy’s bilateral ODA and around a quarter of bilateral ODA from Germany, the Netherlands, Austria and Belgium.
- ODA to humanitarian crises has also risen, by just under 80%, since 2010.
The sharp rise in both humanitarian aid and IDRCs over recent years means that a smaller proportion of aid is being allocated to longer-term development priorities. Maintaining a balanced approach to short-term or crisis interventions and investment in long-term development is critical.
-
Less aid allocated to specific countries – more aid spent in donor countries
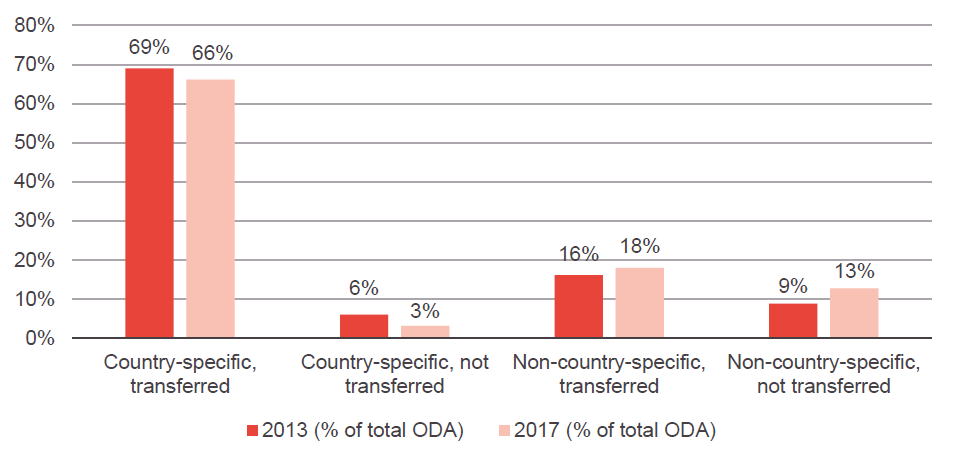
Figure 7: ODA targeting specific countries is falling as a proportion of ODA
Source: Development Initiatives based on OECD DAC data.
- In almost every year from the 1960s up to 2007, between 80%–90% of ODA was allocated to specific countries. By 2016, this had fallen to 68%, before rising slightly to 69% in 2017.
- ODA spent on IDRCs, which reflects spending by donors in their own countries, rose from just over 2% of total ODA in 2010 to 10% in 2016, before falling slightly to 8% in 2017. This has contributed to both a rise in ODA that doesn’t identify specific country beneficiaries, as well as aid that doesn’t result in a transfer out of the donor country.
- Such trends have not been driven by IDRCs alone. Project-related ODA and technical assistance for which donors have not specified a recipient country also grew significantly, from US$8.7 billion in 2010 to US$13.3 billion in 2017.
Financing Agenda 2030 requires a variety of interventions and support but ODA is a finite and precious resource that plays a particularly important role in targeting extreme poverty and supporting interventions which other actors, such as the private sector, are less willing to engage with. As such the gradual but sustained and long-term trend of decreasing aid going to countries where extreme poverty is predicted to become ever more concentrated is one to reverse.