Reversing the trends that leave LDCs behind: How ODA can be targeted to the needs of people living in greatest poverty post-pandemic
This report looks at how trends leaving least developed countries behind can be reversed, and examines how official development assistance can be targeted to meet the needs of the poorest people.
DownloadsExecutive summary
The impacts of the crisis caused by the Covid-19 pandemic will be felt for many years. The global economy shrank by 4.3% in 2020. The expected recovery in 2021 will only marginally offset the downturn at the global level and recovery will not be even. The pandemic has had a starker impact for people who were already facing challenging circumstances, insecurity and low incomes, pushing an estimated 76 million people into extreme poverty in 2020. [1] Richer countries have countered some of the worst effects through unprecedented stimulus packages, estimated at over US$12 trillion globally, [2] but in least developed countries (LDCs) stimulus per capita (person) is 580 times less than in developed countries. This means less to invest in social safety nets and lifelines, supporting jobs and businesses – all vital to economic stability, tackling the health crisis and protecting lives and livelihoods. This significant difference in capacity to respond puts countries on very different paths, sparking growing consensus that Covid-19 is deepening a ‘great divergence’, [3] leaving the poorest countries, and people in the deepest poverty, further behind.
This is a fundamental and long-running challenge that puts the Sustainable Development Goals (SDGs) and the promise to leave no one behind at risk. Extreme poverty is already increasingly concentrated in LDCs. These countries have also seen a disproportionate share of the recent increase in extreme poverty incidence caused by the pandemic, contributing to wider concerns of a divergence in recovery between rich and poor countries. LDCs are expected to see a slower economic recovery. LDCs have lower domestic resources and less capacity to mobilise more at sufficient rates. They capture less of international flows while official development assistance (ODA) plays a greater role in supporting provision of basic goods and services than in other countries.
This divide existed before the pandemic and, despite commitments to bridge it, the world was already off track in meeting those ambitions. While important improvements have been made in some areas, progress in ending poverty had tapered off and was rising in sub-Saharan Africa, hunger was on the rise again after falling for years and progress on tackling malaria had stalled amid many other challenges that were increasingly concentrated in poorer, more fragile countries. [4] Financing was also off track with persistent shortfalls in spending needed to meet SDG financing gaps, [5] which were larger in lower income countries, with some estimating they would remain as much as 10% of gross domestic product (GDP) for key SDG targets by 2025. [6] The longer term impacts of the pandemic risk exacerbating many of these challenges.
For a number of countries ODA will be a key factor in overcoming these barriers, and yet ODA has not been appropriately targeted to LDCs when compared with the levels of poverty and the challenges they face. Evidence on the latest trends in ODA suggests that this picture has changed little during and in response to the pandemic.
Continued divergence for LDCs, where barriers to progress are already high, will undermine a sustainable, equitable and fair recovery. This paper explores how this divergence is playing out, looking at the poverty landscape and the broad financing picture then focusing on how ODA can be better deployed to genuinely build back better.
Key findings
The Covid-19 pandemic has impacted LDCs disproportionately; people in greater poverty have seen more severe effects on their incomes, health, education and nutrition, and progress out of poverty will be slower compared with other countries.
LDCs account for just 14% of the global population and yet a quarter of the increase in extreme poverty (living on less than $1.90 a day per capita) during the pandemic. Furthermore, an estimated 20 million people were pushed below the $1-a-day income level (2011 PPP) in 2020 with more than half (55%) of these people in LDCs. Projections indicate that LDCs will continue to represent around 90% of the countries with poverty rates over 40% in 2021. While there has been a relatively small increase in the absolute numbers of people in poverty in LDCs, recovery from the pandemic is expected to be slower. A further 5 million people are being pushed into extreme poverty in 2021, while poverty rates start to fall again in other developing countries. People already living in poverty in LDCs were much more likely to report falling incomes alongside growing struggles to access healthcare and education and concerns about food security.
Low domestic resources in LDCs leave significant funding shortfalls to respond to the poverty challenge and support critical SDGs.
Domestic resources in LDCs were just US$150 per capita in 2019, much lower than both upper-middle-income countries (US$2,326) and lower-middle-income countries (LMICs) (US$435). The absolute gap in per capita revenues is projected to grow as poorer countries start their recovery from the pandemic’s effects from a much lower baseline. Hence, critical areas such as health are underfunded – spending in LDCs from all sources on health was just US$42 per capita in 2019. In LICs and lower-middle-income countries the minimum per capita spending needed to meet essential universal health coverage was US$79 and US$130, respectively. No LDC has met the targets for combined spending on education and health as a proportion of total government expenditure.
LDCs receive less from key international financial flows, so falls drive greater relative impact on financing capacity.
Foreign direct investment (FDI), remittances and tourism are important flows for LDCs, but they are projected to see a significant downturn. Projected falls in FDI would see a loss of US$4.7 billion in investment over 2019–2021. For LDCs, remittances are equivalent to a higher proportion of GDP (4.6% compared with 2.6% in other developing countries) so the projected 10% contraction of US$5.5 billion from 2019 to 2021 represents an important loss of income to many households. Revenue from tourism has fallen dramatically with expected losses of 60–70% in tourism-dependent LDCs. Across FDI, remittances and tourism flows there has been a cumulative fall of US$51 billion to LDCs over 2019–2021.
Despite rising needs, targeting of ODA to LDCs remains weak and has not improved during the pandemic.
The fall in other international resources highlights the significance of the counter-cyclical role of ODA to LDCs. However, over the last decade ODA to LDCs has grown at a similar rate to other developing countries and at less than half the rate of ODA that is not allocated to specific countries. Disbursements to LDCs, however, have been more volatile than those to other countries over the period. Organisation for Economic Co-operation and Development (OECD) Development Assistance Committee (DAC) donors responded to the pandemic by increasing total ODA by 3.5% in 2020, effectively ending a 4-year period of stagnation. ODA to LDCs, however, increased by half this rate – 1.8%. The upshot is that ODA has not responded to shifting distributions of poverty. By 2025 57% of the world’s people living in extreme poverty is estimated to live in LDCs, up from 31% in 2010 and 50% in 2020. This is not in line with proportions of ODA to LDCs, which have actually fallen over the period from 32% in 2010 to 29% in 2019. Only five donors meet the UN target for ODA to LDCs; if all had met it in 2019 an additional US$35 billion to US$60 billion would have been mobilised.
Concessional [7] lending continues to rise, while ODA to support the most vital sectors to end poverty and develop human capital can be better targeted to LDCs.
In 2020 total ODA grew by 3.5%, while ODA in the form of loans and equity grew by 28%. The proportion of ODA loans to LDCs in 2020 will not be confirmed until early 2022. However, between 2010 and 2019 bilateral ODA loans to LDCs grew five-fold, while grants fell by 9%. It is thus likely that this trend will continue and possibly accelerate.
ODA to critical sectors to develop human capital and poverty alleviation – health, education, social services, agriculture, digitalisation, and water, sanitation and hygiene – has remained a relatively small proportion of total ODA to LDCs: less than half. In health and education, countries with the lowest government resources receive less ODA per capita in poverty than other countries, and LDCs make up most of these. Around three quarters of LDCs received below the developing country median of education ODA (US$36) and health ODA (US$40) per capita in poverty in 2019, the latest year for which sectoral ODA data is available.
Recommendations
Tackling poverty and deepening inequality for LDCs, and redressing the growing divergence to the rest of the world, requires action. There are growing challenges to the poverty focus of ODA, strengthened in many cases by Covid-19. These range from greater domestic self-interest in donor countries to the need to finance global public goods such as the pandemic and climate resilience – all of which put pressure on the limited amount of ODA available. Designing these global investments to better support LDCs is vital, but this analysis clearly supports a case for better targeting of ODA.
- ODA should be much more targeted, based on analysis of poverty and needs at country, household and individual levels, and in the shorter term must respond directly to the needs and challenges created by the pandemic.
- Donors need to prioritise LDCs and allocate ODA in line with the proportion of people living in extreme poverty, meeting the UN target of 0.15–0.20% of gross national income (GNI) as ODA to LDCs. Only five donors met this in 2019. Some LDCs are particularly poorly supported with ODA relative to poverty and domestic resource capacity. Increasing ODA to LDCs in line with the target would mobilise an additional US$35–60 billion, enough to both raise ODA to all LDCs and equalise funding to the countries furthest behind.
- A higher proportion of ODA needs to be allocated to LDCs to sectors that have the greatest impact for people living in extreme poverty. [8]
How has poverty changed in LDCs during the pandemic?
At the end of 2020, an estimated 737 million people were living in extreme poverty as the pandemic reversed years of progress, pushing more than 76 million people back into poverty in 2020 alone. Least developed countries (LDCs) were already disproportionately affected by poverty and its consequences, and this has worsened with the current crisis.
Disproportionate impact of the pandemic on the people living in greatest poverty
The global crisis caused by the Covid-19 pandemic has pushed back progress on ending extreme poverty, wiping out seven years of progress. It has been argued that recovery is also likely to be slowest among people living in poverty as developing countries fall further behind richer countries and emerging economies, driving a growing gap between the people in greatest poverty and the rest. [9] This will likely have a disproportionate impact in LDCs where poverty is more concentrated.
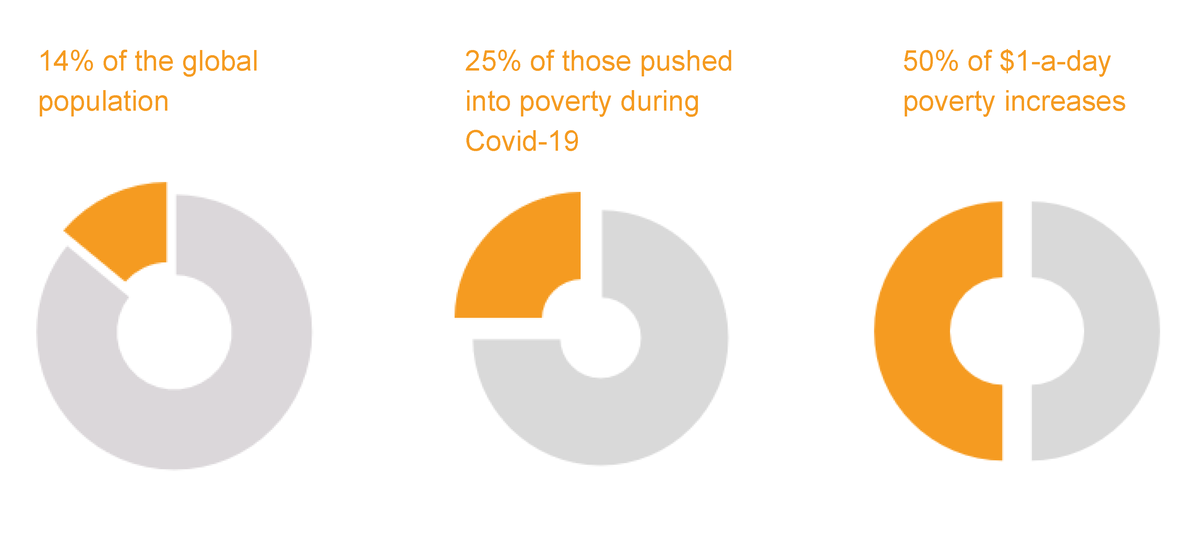
Figure 1: LDCs account for a disproportionate share of recent poverty increases
In 2020, LDCs globally accounted for:
| LDCs | Other countries | |
|---|---|---|
|
Share of
global population |
14% | 86% |
| Share of people pushed into poverty during Covid-19 pandemic | 25% | 75% |
| Share of population in $1.00 a day poverty increases | 50% | 50% |
Sources: Development Initiatives based on World Bank PovcalNet, International Monetary Fund (IMF) World Economic Outlook and UN population division.
Note: LDC: least developed country.
Extreme poverty has become increasingly concentrated in LDCs over the last decade. In 2020, LDCs accounted for an estimated 48% of people in extreme poverty, while in 2010 this was 29%.
This trend risks being exacerbated further as LDCs accounted for a disproportionate share of increases in poverty driven by the pandemic. Whilst LDCs constitute 14% of the global population, they accounted for 25% of increased extreme poverty incidence (living on less than $1.90 a day per capita in 2011 PPP) in 2020 (Figure 1). They account for an even greater proportion of increases in $1-a-day poverty (2011 PPP), pushing large numbers of people into even deeper poverty. It is estimated that another 20 million people may have fallen below this line in 2020 globally, of whom around 55% were in LDCs. This level accounted for approximately 12% of LDCs’ populations in 2019, rising to 13% in 2020, and it is expected to remain at that level in 2021. By contrast, this accounts for less than 1% of the total population of other developing countries.
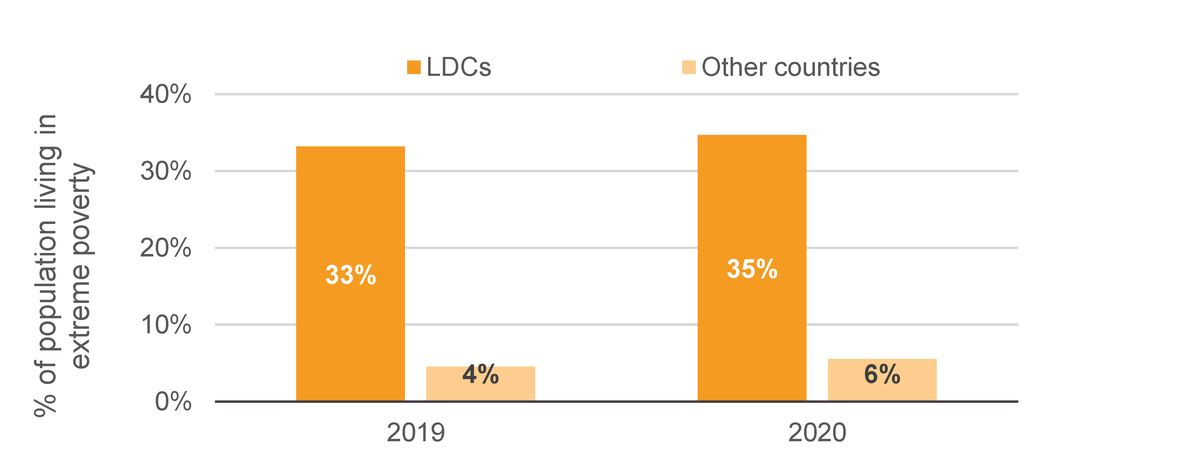
Figure 2: The proportion of people living in extreme poverty in LDCs has been pushed even higher by the pandemic
Estimates of the percentage of the population living in extreme poverty in LDCs and other countries, 2019 and 2020
The proportion of people living in extreme poverty in LDCs thus increased from 33% in 2019 (23 million people) to 35% in 2020 (362 million people) (Figure 2). And while some recovery is expected for LDCs in 2021, this is only likely to drop one percentage point, which nonetheless represents an additional 5 million people falling into poverty due to population growth. The countries facing the most extreme levels of poverty will remain largely the same in 2021 – they include South Sudan, where extreme poverty will grow only 1% but reach 87% in 2021, Burundi (81%) and Madagascar (77%).
Similarly, countries experiencing protracted crises and fragile and extremely fragile countries – of which four-fifths are LDCs – have all seen increases in the proportion of their populations living in extreme poverty, with little recovery expected in 2021.
LDCs will still make up the vast majority of countries with extremely high poverty rates in 2021: approximately nine in ten of countries with more than 40% of their population in extreme poverty. LDCs make up approximately two-thirds of the countries that saw more than a 2% increase in poverty in 2020 and just over half of those expected to see an increase in 2021.
Distributional effects of poverty trends since Covid-19 in LDCs
The previous section has considered effects at an aggregate national level, with projections assuming that people across income distributions will be equally impacted by changes in gross domestic product (GDP). The impact is however likely to be unevenly distributed, with those at the bottom of the income distribution feeling the worst effects and having the least resilience to shocks. The International Monetary Fund (IMF) has already estimated that the pandemic will have seen incomes fall globally by 13% from pre-pandemic levels – but this will be more acute in poorer countries, with an 18% fall in low-income countries (LICs) and a 22% fall in emerging and developing economies (excluding China). [10]
During the pandemic, the World Bank has conducted pulse surveys in dozens of countries [11] to better understand effects at the household level. These have given a timely, nuanced and detailed picture of the real effects on people’s lives and a better understanding of the impacts for people living in poverty, showing the distribution of negative effects. These surveys cover some LDCs and data from Burkina Faso, Ethiopia, Malawi and Uganda provides critical insights into how people’s lives and incomes have been affected.
Across the countries analysed, most households reported falls in income, and this continued to worsen through the year. In Burkina Faso, the first survey in May 2020 saw 73% of households’ (non-farm) incomes fall. For many people already in extreme poverty, this situation worsened with almost a quarter of households reporting continued falls in business income between August and September. Over three quarters (77%) of households in Ethiopia and Uganda reported that their incomes fell between March and the first round of surveys (in late spring or early summer). [12]
The impact on incomes is worse for people already at the bottom of the income distribution. In each of six surveys conducted in Ethiopia, the poorest 20% of people were more likely to report seeing incomes decrease. While the scale of the loss of income is not reported, for people with very low incomes pre-pandemic (i.e. those in the poorest quintile), even a small loss represents a serious impact and makes precarious living even more so.
In Burkina Faso, people already living in poverty were more likely to report difficulties and greater challenges across indicators on education, health and food security – highlighting the scale and breadth of impact and relative lack of resilience to major shocks. For households already in extreme poverty, access to adequate nutrition was also a serious concern for nearly 75%. In many countries there have been efforts to target people in poverty with new social protection resources, [13] but in Burkina Faso 74% of people receiving government assistance since the beginning of the pandemic were not classified as being in poverty.
It has been well documented that the pandemic has had a disproportionate effect on women, exposing and exacerbating existing inequalities. [14] A September 2020 forecast [15] estimated that 36% of women in LDCs would be in extreme poverty in 2021 compared with 35% of men. The gender gap is widest in the 25–34 age range, in which 31% of women are estimated to be in extreme poverty in 2020 compared with 26% of men. These estimates likely underestimate the magnitude of differences in extreme poverty by gender as the data used for these calculations is collected at the household level. [16] Without individual level data that can be fully disaggregated by gender, it is not possible to identify women living in non-poor households that have no or limited access to their own income and have no say on how household resources may be used or spent. Other impacts of COVID-19, such as increased childcare burdens, reduced public and private spending on services such as education or childcare, have a disproportionate impact on women, but are not accounted for in the income poverty statistics.
The impact of the pandemic – in lost income, access to education, healthcare and adequate nutrition – on the people living in greatest poverty in LDCs has been particularly acute and will mean longer term challenges to recovery. The disproportionate impact on people already in challenging circumstances and more vulnerable to the shocks of such a crisis may have far-reaching consequences on quality of life, human development and future economic potential. Support to weather these shocks and accelerate progress is vital.
How has Covid-19 impacted development finance in LDCs?
LDCs face a long road to recovery, more so than other developing countries, including in financing that recovery. LDCs themselves highlighted at the start of the Covid-19 pandemic that there was already a “liquidity crisis in their own public spending and [they were] facing difficulties in borrowing from the international market”. [17] Official development assistance (ODA) is a vital source of funding – up to two thirds of external financing in LDCs [18] – but also a finite one, therefore seeing it in the context of other resources is critical. This section analyses other important sources of finance including domestic finance and other international flows, and how that picture has evolved during Covid-19.
Constrained domestic resources in LDCs mean critical needs and sectors are poorly supported
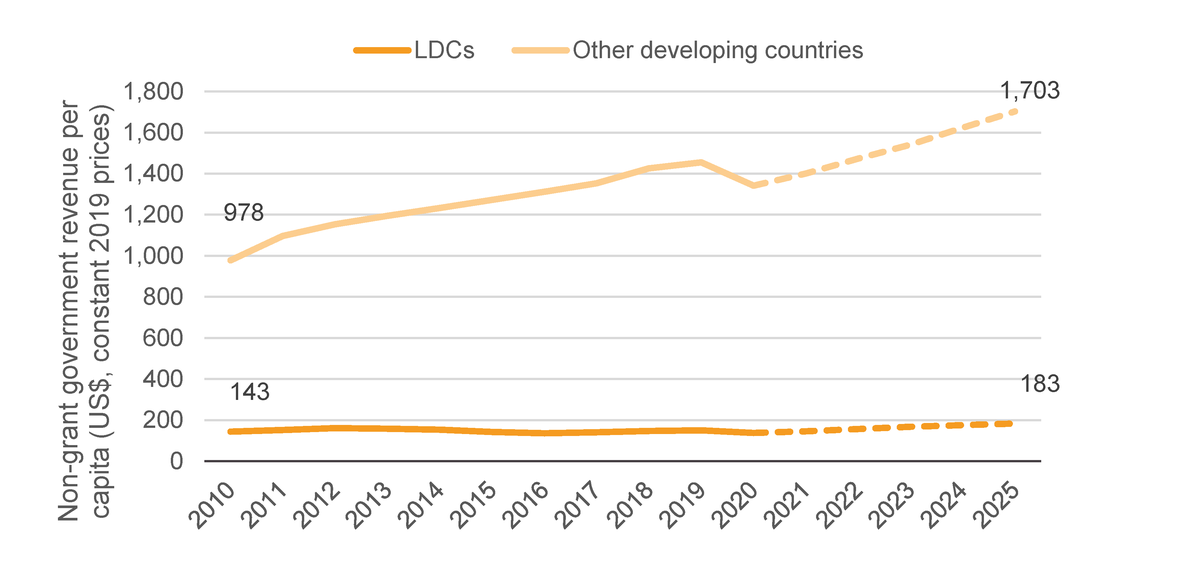
Domestic resources are the most important to support long-term development in all developing countries and will be vital to supporting recovery. However, there is a significant gap in scale across developing countries, as evident in the vast difference in stimulus packages and social protection during the crisis. Non-grant government revenue in LDCs was US$150 per capita in 2019, compared with US$14,820 in high-income countries. The difference between these levels and upper-middle-income countries (US$2,326) and lower-middle-income countries (LMICs) (US$435) is smaller but remains notable. Furthermore, even before the pandemic, the gap between LDCs and other developing countries was already growing as non-grant government revenue in LDCs shrank in the decade to 2019 as a proportion of GDP [19] and growth was relatively flat (Figure 3).
Figure 3: The domestic resource gap between LDCs and other developing countries will grow again after the pandemic
Non-grant government revenue per capita, 2010–2019 and projected to 2025
|
Country
group |
2010 | 2011 | 2012 | 2013 | 2014 | 2015 | 2016 | 2017 | 2018 | 2019 | 2020 | 2021 | 2022 | 2023 | 2024 | 2025 |
|---|---|---|---|---|---|---|---|---|---|---|---|---|---|---|---|---|
| LDCs | 143 | 152 | 161 | 158 | 154 | 143 | 136 | 141 | 147 | 150 | 138 | |||||
| Other developing countries | 978 | 1096 | 1153 | 1195 | 1232 | 1273 | 1311 | 1352 | 1426 | 1455 | 1341 | |||||
|
LDC
non-grant government revenue (US$ billions) |
138 | 145 | 157 | 167 | 175 | 183 | ||||||||||
| Non-LDC developing countries | 1341 | 1400 | 1473 | 1540 | 1624 | 1703 |
Source: International Monetary Fund (IMF) Article IV.
Notes: Data is in US$ billions. Countries for which no government revenue data is available in any year from 2010 onwards have been excluded. LDC: least developed country.
Growth projections (see Appendix: Methodology ) suggest that while revenues in all countries were impacted in 2020, and more significant in absolute terms in other developing countries, they are expected to recover fairly quickly, with their growth predicted to accelerate back past pre-pandemic levels. In LDCs, domestic revenues are also expected to recover over the coming years but starting from such a low base that, despite higher growth rates, divergence in absolute per capita terms will continue.
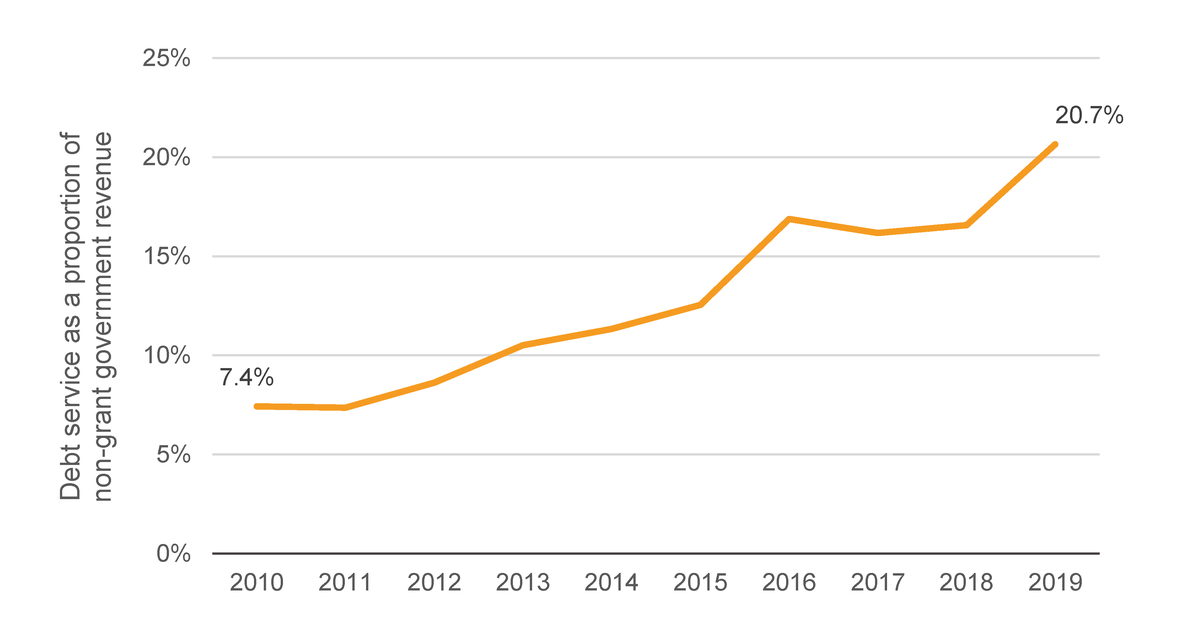
The pandemic is also expected to exacerbate already-rising levels of debt. Just over a decade ago, almost a quarter of LICs were in or at risk of debt distress, which had grown to half by 2019. Covid-19 is likely to have increased this further. [20] As of June 2021, four LDCs were already in debt distress with sixteen more at high risk, [21] and this is likely to worsen as the debt burden increases. 2020 saw considerable growth in bilateral aid in the form of loans and equity investments, increasing by 28% compared with a 3.5% growth in ODA overall (see below). It is not yet known what proportion of ODA loans have gone to LDCs in 2020. However, between 2010 and 2019 bilateral ODA loans to LDCs grew five-fold, while grants fell by 9%. It is thus likely that this trend will continue and possibly accelerate. Analysis of real-time (but unverified [22] ) International Aid Transparency Initiative (IATI) data from key international financial institutions (IFIs) showed that ODA to LDCs grew at least US$8 billion in 2020, with the vast majority in the form of loans. A key question is how this might constrain the domestic resources available to governments. Debt service, which has grown rapidly in recent years (Figure 4), is a critical and growing pressure, limiting the domestic government revenue available for sustainable development.
Figure 4: Debt service in LDCs more than doubled as a proportion of government resources in the last decade
Debt service as a proportion of non-grant government revenue in LDCs, 2010–2019
| Type | 2008 | 2009 | 2010 | 2011 | 2012 | 2013 | 2014 | 2015 | 2016 | 2017 | 2018 | 2019 |
|---|---|---|---|---|---|---|---|---|---|---|---|---|
| Debt Service | 7.6 | 9.3 | 8.5 | 10.5 | 13.7 | 16.8 | 18.4 | 17.5 | 21.5 | 22.6 | 24.7 | 31.4 |
| Non-grant government revenue | 104.2 | 83.3 | 114.8 | 142.4 | 158.8 | 160.3 | 162.6 | 139.7 | 127.1 | 139.7 | 149.3 | 152.0 |
|
Debt service %
government revenue |
7.3% | 11.1% | 7.4% | 7.4% | 8.6% | 10.5% | 11.3% | 12.5% | 16.9% | 16.2% | 16.6% | 20.7% |
Sources: Development Initiatives based on International Monetary Fund (IMF) World Economic Outlook data, IMF Article IV staff and programme review reports (various), and World Bank World Development Indicators.
Note: LDC: least developed country.
LDCs have increasingly accessed non-traditional and non-concessional sources of credit, such as bond issuance. As such, their debt service ratios had risen sharply even before the pandemic: from 1.4% of gross national income (GNI) in 2008 to almost 3% in 2019. Debt service as a proportion of non-grant revenues in LDCs has more than doubled over the last decade, from 7.4% of government revenues in 2010 to just over 20% in 2019.
This means LDCs now have a lower capacity to finance investments in sectors critical to human capital and development. This is not simply down to poor allocation decisions – on average LDCs spend only slightly less on debt service than they do on health and education combined. While debt service climbed to US$31.4 billion in 2019 – over 20% of government revenue – combined government spending on health and education was US$36.4 billion: US$9.8 billion for health in 2018 and US$26.6 billion for education in the latest year for which there is data. [23]
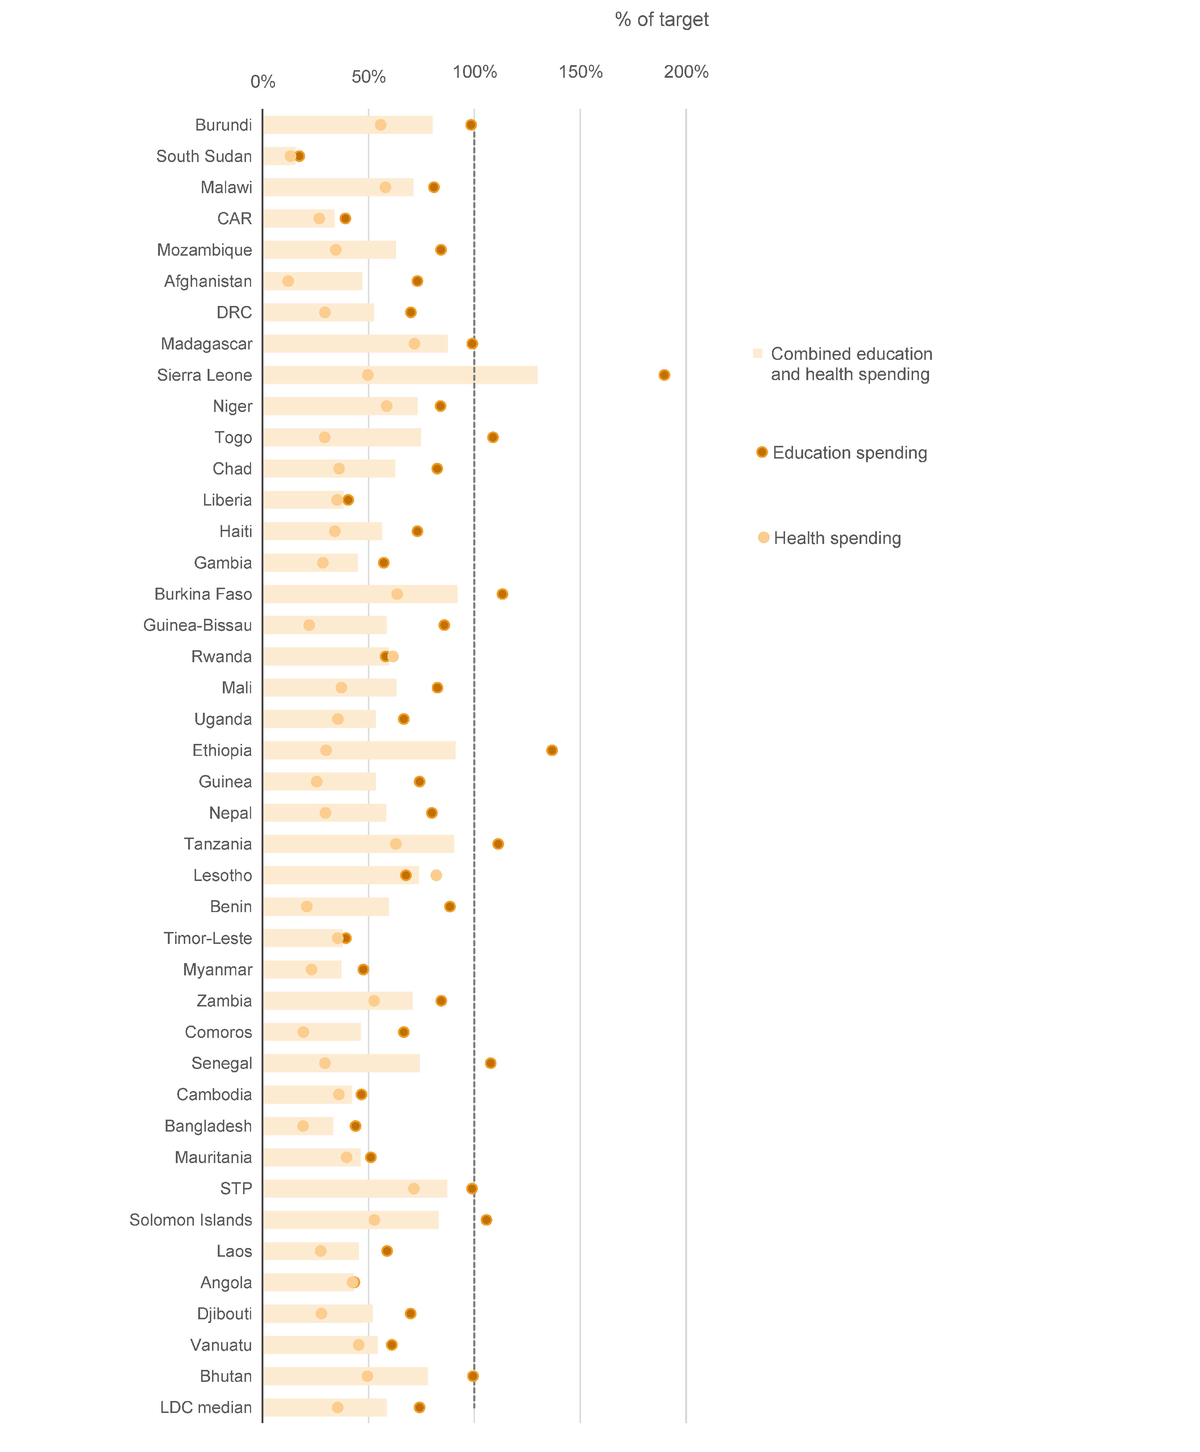
The World Health Organization (WHO) emphasises that Covid-19 has had a devastating effect on health systems globally but that LIC health budgets have been disproportionately affected. The long-term economic crisis, higher debt servicing and depressive effect on other flows could see domestic and other spending on critical sectors constrained further. [24] Even before the crisis almost all LDCs were unable to meet internationally recognised targets for spending on health and education (Figure 5).
Figure 5: Few LDCs meet combined targets for government spending on education and health
Proportion of countries below internationally recognised targets for spending on education and health
|
Country
Name |
Country Code |
Developing
country |
LDC |
Income Group
(2018) |
Education
spending |
Health spending |
Combined
education and health spending |
|---|---|---|---|---|---|---|---|
| Burundi | BDI | 1 | 1 | Low income | 99% | 56% | 80% |
| South Sudan | SSD | 1 | 1 | Low income | 17% | 13% | 16% |
| Malawi | MWI | 1 | 1 | Low income | 81% | 58% | 71% |
| CAR | CAF | 1 | 1 | Low income | 39% | 27% | 34% |
| Mozambique | MOZ | 1 | 1 | Low income | 84% | 35% | 63% |
| Afghanistan | AFG | 1 | 1 | Low income | 73% | 12% | 47% |
| DRC | COD | 1 | 1 | Low income | 70% | 29% | 53% |
| Madagascar | MDG | 1 | 1 | Low income | 99% | 72% | 87% |
| Sierra Leone | SLE | 1 | 1 | Low income | 190% | 50% | 130% |
| Niger | NER | 1 | 1 | Low income | 84% | 59% | 73% |
| Togo | TGO | 1 | 1 | Low income | 109% | 29% | 75% |
| Chad | TCD | 1 | 1 | Low income | 82% | 36% | 63% |
| Liberia | LBR | 1 | 1 | Low income | 40% | 35% | 38% |
| Haiti | HTI | 1 | 1 | Low income | 73% | 34% | 56% |
| Gambia | GMB | 1 | 1 | Low income | 57% | 28% | 45% |
| Burkina Faso | BFA | 1 | 1 | Low income | 113% | 64% | 92% |
| Guinea-Bissau | GNB | 1 | 1 | Low income | 86% | 22% | 59% |
| Rwanda | RWA | 1 | 1 | Low income | 58% | 62% | 60% |
| Mali | MLI | 1 | 1 | Low income | 83% | 37% | 63% |
| Uganda | UGA | 1 | 1 | Low income | 67% | 36% | 53% |
| Ethiopia | ETH | 1 | 1 | Low income | 137% | 30% | 91% |
| Guinea | GIN | 1 | 1 | Low income | 74% | 26% | 53% |
| Nepal | NPL | 1 | 1 | Lower middle income | 80% | 30% | 58% |
| Tanzania | TZA | 1 | 1 | Lower middle income | 111% | 63% | 91% |
| Lesotho | LSO | 1 | 1 | Lower middle income | 68% | 82% | 74% |
| Benin | BEN | 1 | 1 | Lower middle income | 89% | 21% | 60% |
| Timor-Leste | TLS | 1 | 1 | Lower middle income | 39% | 35% | 38% |
| Myanmar | MMR | 1 | 1 | Lower middle income | 48% | 23% | 37% |
| Zambia | ZMB | 1 | 1 | Lower middle income | 84% | 53% | 71% |
| Comoros | COM | 1 | 1 | Lower middle income | 67% | 19% | 46% |
| Senegal | SEN | 1 | 1 | Lower middle income | 108% | 29% | 74% |
| Cambodia | KHM | 1 | 1 | Lower middle income | 47% | 36% | 42% |
| Bangladesh | BGD | 1 | 1 | Lower middle income | 44% | 19% | 33% |
| Mauritania | MRT | 1 | 1 | Lower middle income | 51% | 40% | 46% |
| STP | STP | 1 | 1 | Lower middle income | 99% | 72% | 87% |
|
Solomon
Islands |
SLB | 1 | 1 | Lower middle income | 106% | 53% | 83% |
| Laos | LAO | 1 | 1 | Lower middle income | 59% | 27% | 45% |
| Angola | AGO | 1 | 1 | Lower middle income | 43% | 42% | 43% |
| Djibouti | DJI | 1 | 1 | Lower middle income | 70% | 28% | 52% |
| Vanuatu | VUT | 1 | 1 | Lower middle income | 61% | 45% | 54% |
| Bhutan | BTN | 1 | 1 | Lower middle income | 99% | 50% | 78% |
| LDC median | LDC median | 74% | 35% | 59% |
Sources: UNESCO, WHO Global Health Expenditure Database, International Monetary Fund (IMF) World Economic Outlook.
Notes: Countries are in ascending order of gross national income (GNI) per capita. Targets are based on the following: spending on education, which has a target of 20% of total government expenditure, as set by the Education for All Coalition, UNESCO (2015); spending on health, which has a target of 15% of government expenditure. This is the Abuja Declaration (2001) target that was agreed by African countries, but we consider it to be a reasonable target for other states too. Data is for latest year available. CAR: Central African Republic; DRC: Democratic Republic of the Congo; LDC: least developed country; STP: São Tomé and Príncipe.
None of the 41 LDCs (those of the 47 LDCs with data available) meets both targets, only seven meet the education target and none meets the health target. Average combined spend on health and education in LDCs falls well below the combined target of 35% of total government expenditure at just under 20%. [25]
This gap between need and potential finance highlights a persistent challenge that is likely to be exacerbated by the pandemic and the impact it will have on all sources of finance. There is substantial distance to be covered to meet targets for allocation of government spending (Figure 5), ones that remain largely out of reach for LDCs and have been pushed further out of reach by Covid-19.
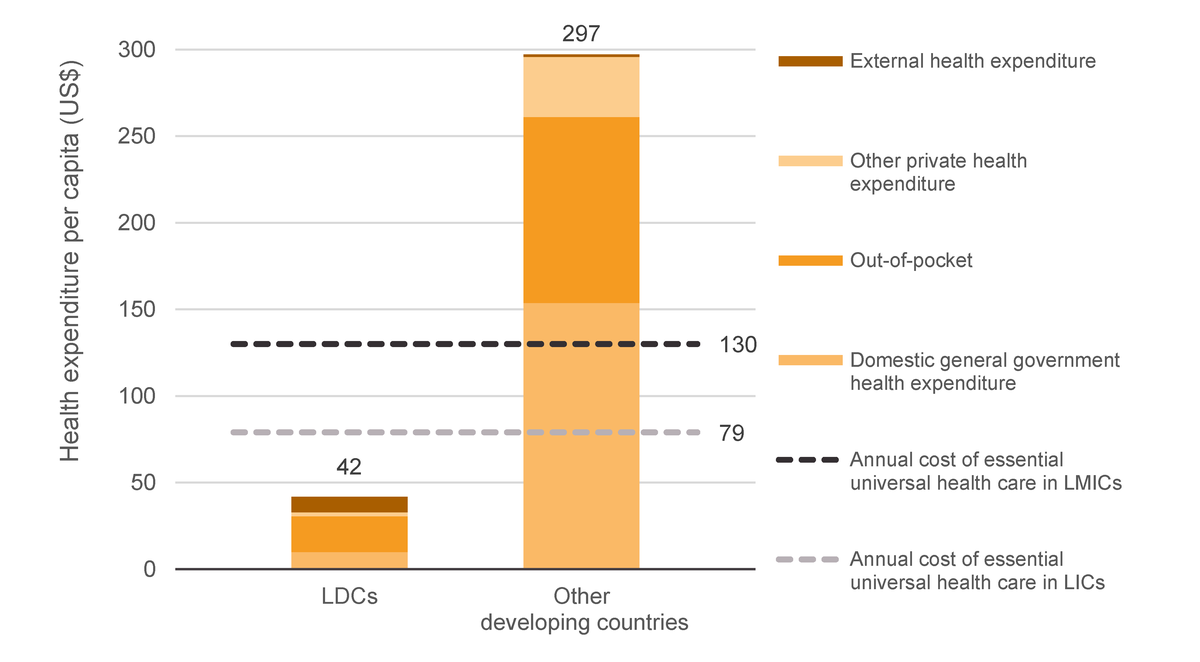
LDCs are much further than other developing countries from being able to cover the costs of essential universal health coverage even when external sources of finance such as ODA are included (Figure 6).
Figure 6: Financing in LDCs falls far short of that needed to meet essential universal healthcare
Essential universal healthcare costs in LMICs and LICs compared with health expenditure in LDCs and other developing countries, per capita, 2018
|
Category
(US$ per capita) |
LDCs | Other developing countries |
|---|---|---|
|
Annual cost of essential
universal health care in LICs |
79 | |
|
Annual cost of essential
universal health care in LMICs |
130 | |
| Out-of-pocket | 21 | 107 |
|
Other private health
expenditure |
2 | 35 |
| External health expenditure | 9 | 1 |
|
Domestic general government
health expenditure |
10 | 154 |
| Total | 42 | 297 |
Source: WHO Global Health Expenditure Database.
Notes: Average annual cost per capita of essential universal healthcare at 80% coverage in low-income countries (LICs) and lower-middle-income countries (LMICs) based on estimates provided in the Lancet. [26]
LDC: least developed country.
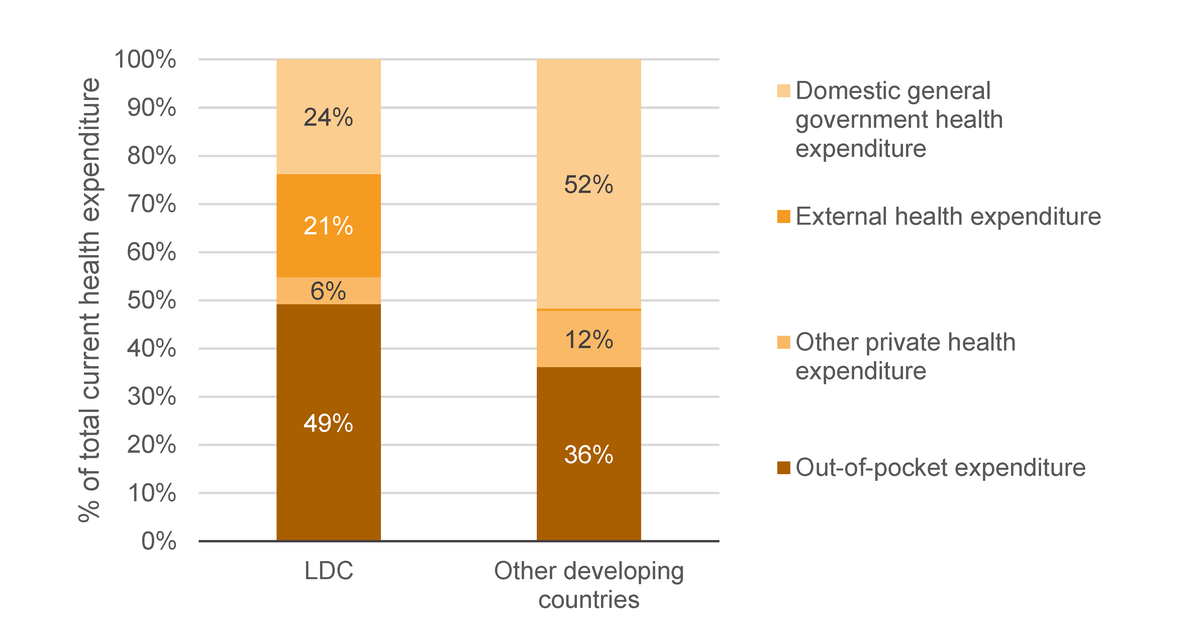
As a result of limited resources, being able to access services such as health and education too often depends on having the capacity to pay, particularly in poorer countries (Figure 7). [27] Combined with falling incomes this paints a concerning picture, particularly for the people living in greatest poverty.
Figure 7: Out-of-pocket expenditure on health is much higher in LDCs but government expenditure is much lower
Types of expenditure making up spending on health in LDCs and other developing countries, 2018
|
Health
expenditure category |
LDC | Other developing countries | Total | LDC | Non-LDC | Total |
|---|---|---|---|---|---|---|
| Out-of-pocket | 20356.53 | 553277.5 | 573634.1 | 49% | 36% | 36% |
|
Other private health
expenditure |
2351.752 | 178904.2 | 181255.9 | 6% | 12% | 12% |
| External health expenditure | 8828.772 | 6851.409 | 15680.18 | 21% | 0% | 1% |
|
Domestic general government
health expenditure |
9847.843 | 791676.3 | 801524.2 | 24% | 52% | 51% |
| Current health expenditure | 41384.9 | 1530709 | 1572094 | 100% | 100% | 100% |
Source: WHO Global Health Expenditure Database.
Note: External health expenditure in other developing countries makes up 0.4% as a proportion of total and is not visible on the chart. LDC: least developed country.
In 2018, the latest year for which there is reliable data, out-of-pocket health expenditure was a much more important part of spending on health (49%) in LDCs than in other developing countries (36%). Over half of health expenditure in the latter was government expenditure (52%) compared with under a quarter in LDCs (24%). ODA, which makes up most external health expenditure, was also a much larger part of total health spending in LDCs, at 21% compared with 0.4% in other developing countries. There is also a sizable difference of scale in out-of-pocket expenditure in other developing countries at US$107 per capita compared with just US$21 in LDCs.
Falls in international financial flows in LDCs will further constrain the ability to finance sustainable development
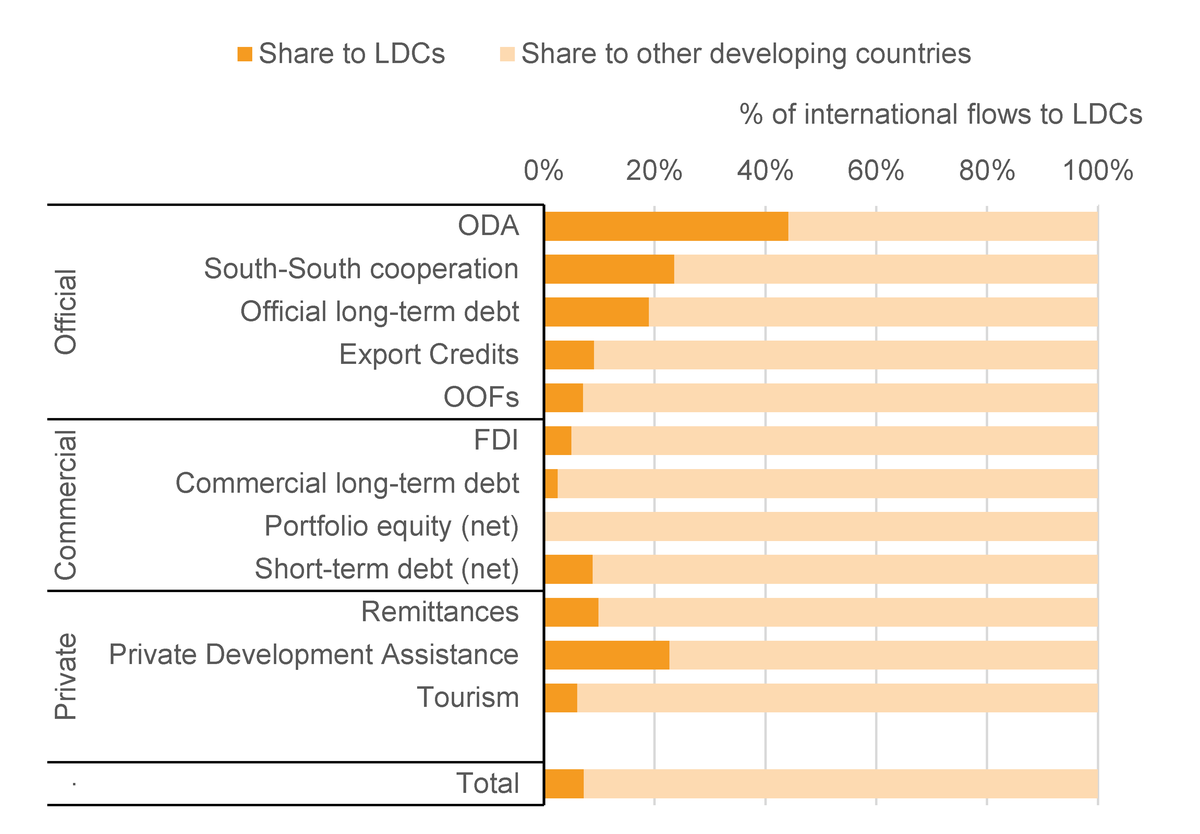
In this context of constrained domestic finance with significant and growing demands and needs, external sources of resources are critical. Whilst LDCs capture less of all major international financial flows compared with other developing countries (Figure 8), all such flows have been negatively impacted by the pandemic.
Figure 8: LDCs capture very small proportions of international financial flows
Share of international financial flows to LDCs, 2019
| Share to LDCs |
Share to other
developing countries |
||
|---|---|---|---|
| Official | ODA | 53864 | 68181 |
|
South-South
cooperation |
3384 | 10966 | |
|
Official long-term
debt |
8225 | 35097 | |
| Export Credits | 1595 | 16012 | |
| OOFs | 4706 | 61603 | |
| Commercial | FDI | 25617 | 488665 |
|
Commercial long-term
debt |
24916 | 958594 | |
|
Portfolio equity
(net) |
22 | 65206 | |
| Short-term debt (net) | 4324 | 44787 | |
| Private | Remittances | 49937 | 453670 |
|
Private Development
Assistance |
900 | 3063 | |
| Tourism | 24995 | 390114 | |
| . | Total | 202484 | 2595960 |
Source: Development Initiatives based on World Bank, UN Conference on Trade and Development’s UNCTADStat and OECD data.
Notes: FDI: foreign direct investment; LDC: least developed country; ODA: official development assistance; OOF: other official flow.
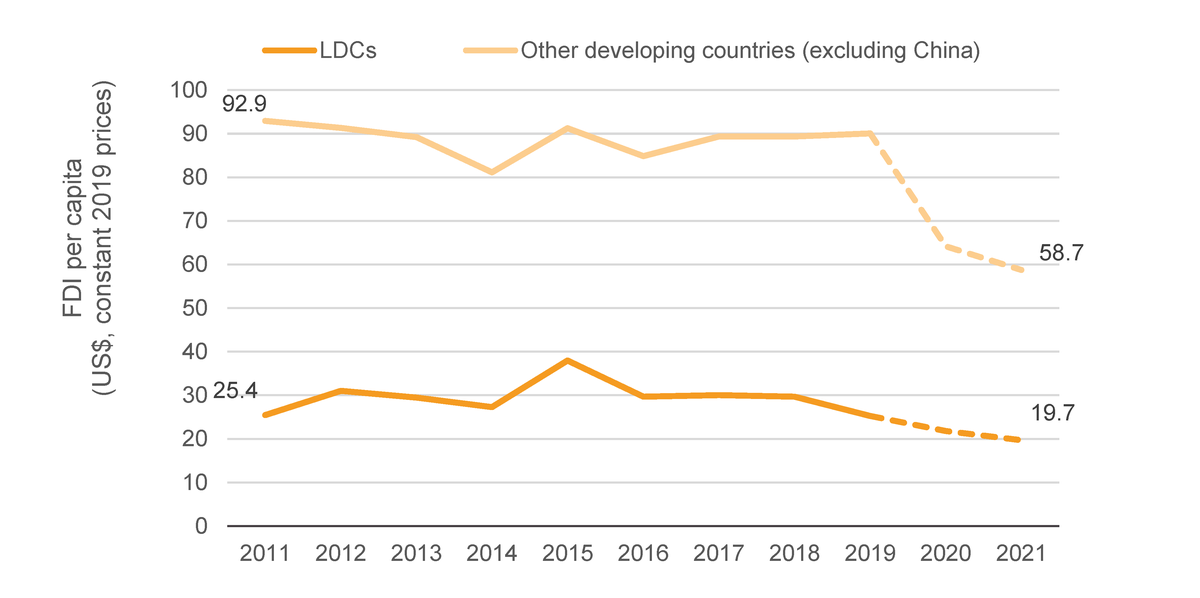
LDCs struggle comparatively to access markets and investment due to a range of factors such as capacity, investable projects and perceptions of risk. [28] Whilst LDCs receive only a small proportion of global foreign direct investment (FDI), it is one of the most important international inflows, making up over 12.7% of international inflows going to this group of countries and equivalent to 17% of total LDC non-grant revenues in 2019. Such flows are pro-cyclical, and Covid-19 is expected to drive substantial capital outflows and falls in FDI.
Figure 9: FDI remains an important but shrinking source of finance in LDCs
FDI in LDCs and other developing countries (excluding China), 2011–2021
|
FDI per
capita |
2000 | 2001 | 2002 | 2003 | 2004 | 2005 | 2006 | 2007 | 2008 | 2009 | 2010 | 2011 | 2012 | 2013 | 2014 | 2015 | 2016 | 2017 | 2018 | 2019 | 2020 | 2021 |
|---|---|---|---|---|---|---|---|---|---|---|---|---|---|---|---|---|---|---|---|---|---|---|
| LDCs | 12.0 | 20.8 | 18.7 | 30.8 | 21.7 | 14.4 | 18.6 | 20.7 | 24.6 | 20.4 | 31.7 | 25.4 | 31.0 | 29.5 | 27.3 | 38.0 | 29.7 | 30.0 | 29.7 | 25.2576513 | ||
|
Other developing countries
(excluding China) |
59.4 | 64.6 | 57.4 | 51.1 | 63.4 | 75.3 | 79.2 | 99.7 | 106.8 | 80.7 | 90.0 | 92.9 | 91.3 | 89.2 | 81.1 | 91.3 | 84.8 | 89.3 | 89.3 | 90.0505576 | ||
| 29.7 | 25.3 | 21.8 | 19.7 | |||||||||||||||||||
| 89.3 | 90.1 | 64.1 | 58.7 |
Source: Development Initiatives based on International Monetary Fund (IMF) World Economic Outlook and UNCTAD’s UNCTADStat and Investment Trends Monitor.
Notes: Data for 2020 and 2021 is based on UNCTAD estimates at regional and global levels. Gross domestic product (GDP) data for 2020 and 2021 is based on IMF World Economic Outlook estimates at the country level. FDI: foreign direct investment; LDC: least developed country.
FDI is estimated to have fallen by 0.5% of GDP in LDCs between 2019 and 2021 (Figure 9). While this drop may sound small, it equates to a loss of US$4.8 billion in investment. Such falls are also expected to last longer in poorer countries due to increased uncertainty, unpredictability in their markets and reduced risk tolerance of private investment. [29] In the short term at least, divergence in access to international private capital may be further exacerbated by inequitable access to Covid-19 vaccinations, where countries with low vaccination rates overlap with those that attract comparatively small volumes of FDI.
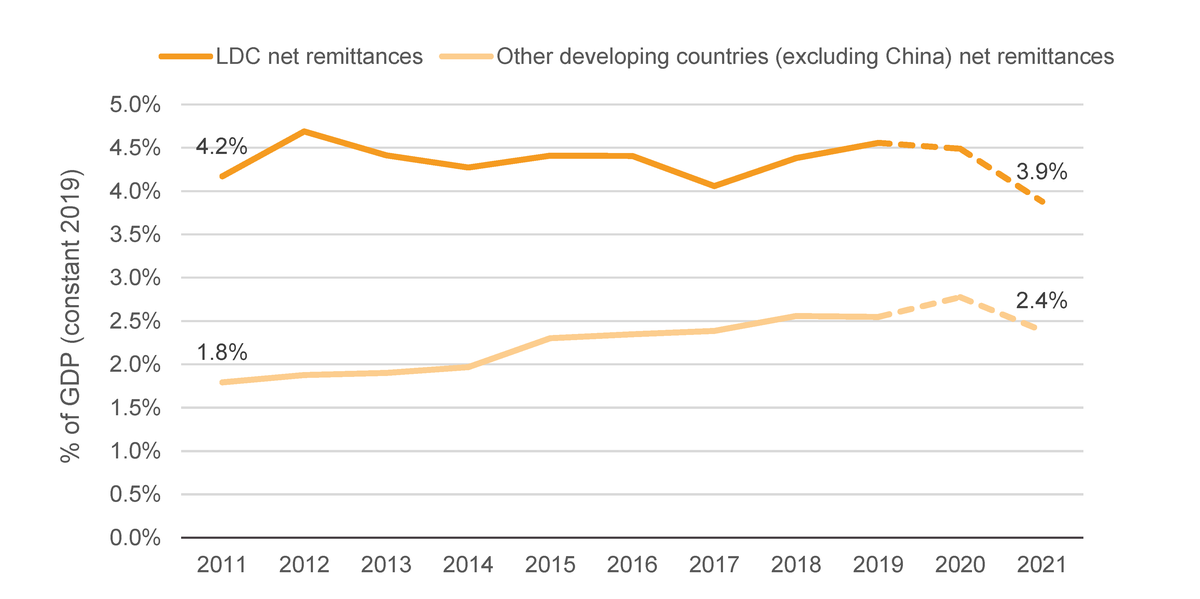
Remittances are also an important source of finance in LDCs – particularly at the household level – and equalled almost 5% of GDP in 2019. [30] But these too have seen a substantial decline, with the World Bank estimating a 7.2% (US$40 billion) fall to LICs and middle-income-countries (MICs) in 2020, and a further fall of US$38 billion expected in 2021. [31] Remittances to sub-Saharan Africa fell 9% in 2020. By applying regional average projections to LDCs, remittances to these countries would fall an estimated US$5.5 billion – over 10% – during 2019–2021.While other developing countries have seen a sharper contraction than LDCs (Figure 10), they are starting from a higher base. But remittances also represent a high proportion of GDP in LDCs – 4.6% compared with 2.6% in other developing countries in 2019. Thus proportional impacts to LDCs can be substantial.
Figure 10: Already lower in LDCs, remittances have fallen during the pandemic
Remittances to LDCs and other developing countries as a proportion of GDP, 2011–2019 and projected to 2021
|
Net Remittances %
of GDP |
2011 | 2012 | 2013 | 2014 | 2015 | 2016 | 2017 | 2018 | 2019 | 2020 | 2021 |
|---|---|---|---|---|---|---|---|---|---|---|---|
| LDC | 4.2 | 4.7 | 4.4 | 4.3 | 4.4 | 4.4 | 4.1 | 4.4 | 4.6 | 4.5 | 3.9 |
|
Other developing countries (excluding
China) |
1.8 | 1.9 | 1.9 | 2.0 | 2.3 | 2.3 | 2.4 | 2.6 | 2.5 | 2.8 | 2.4 |
Source: Development Initiatives based on World Bank, KNOMAD, International Monetary Fund (IMF) World Economic Outlook and World Bank Remittance Prices Worldwide, available at http://remittanceprices.worldbank.org.
Notes: The average cost of sending remittances was subtracted at the recipient level, giving a measure of net remittance inflows. Data for 2020 is based on World Bank estimates at the country level, while data for 2021 is based on regional estimates from the World Bank and KNOMAD. Gross domestic product (GDP) data for 2020 and 2021 is based on IMF World Economic Outlook estimates at the country level. LDC: least developed country.
Tourism is another major source of international financing in LDCs severely impacted by the pandemic. For economies that rely on one form of economic activity and income, such as tourism, this will have a harsh impact, with jobs and livelihoods lost as well as critical domestic revenue. Tourism receipts are projected to have plummeted from 60% to 70% for many countries. In Vanuatu, for example, where tourism represents around two thirds of GDP, [32] receipts per capita are estimated to have fallen from just over US$1,100 to less than US$350. The likelihood of a rapid recovery in 2021 given ongoing travel and other restrictions is small.
LDCs are under-resourced and rely on a relatively small number of sources of financing that are being adversely affected by the pandemic – exacerbating the existing divergence between LDCs and the rest of the world.
Is ODA effectively targeted to needs, and what has changed in the pandemic?
The pandemic has pushed the Sustainable Development Goals (SDGs), already off-track for many LDCs, even further out of reach. [33] A shift in prioritisation is required if leaving no one behind is a genuine ambition. ODA (characterised by a comparative advantage of being able to directly target drivers of poverty and be counter-cyclical to crises, and thus partly counteract falls in other source of finance) has a critical role to play. [34] ODA remains a more important source of finance for many LDCs, so understanding key trends in its allocation and the emerging effects of the pandemic inform ODA’s unique role in LDCs and what a future agenda of action needs to address.
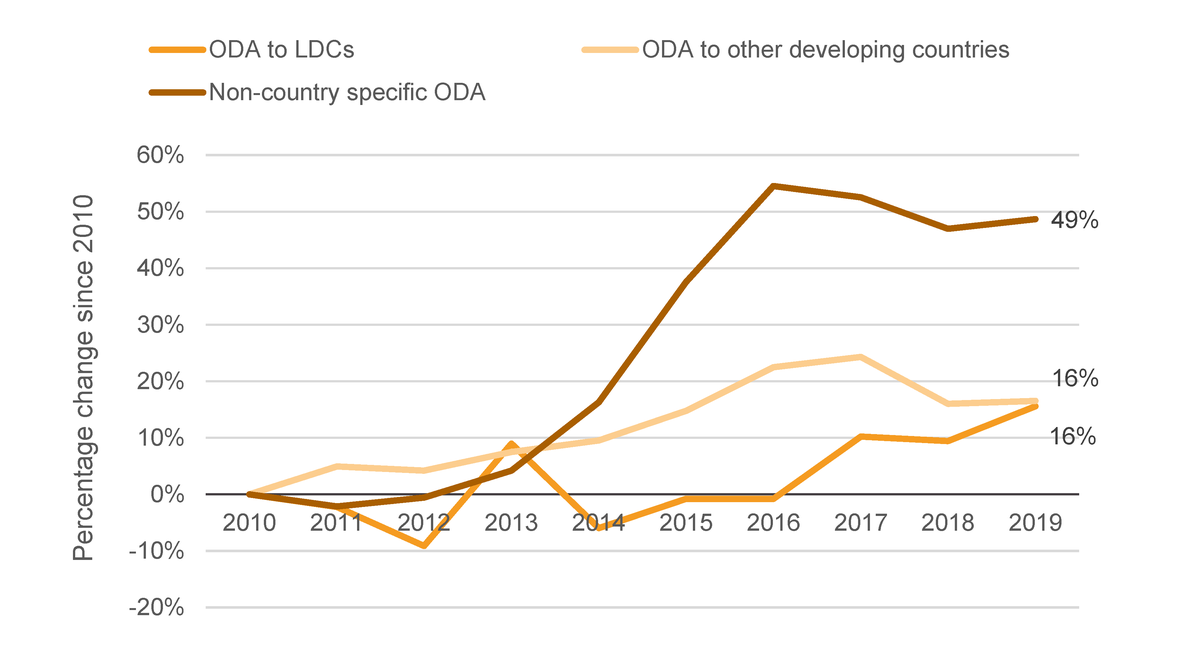
There has not been a change in the prioritisation of ODA to LDCs over the last decade despite long-standing calls to do so and commitments to deliver 0.15–0.20% of GNI as ODA to LDCs. [35] Since 2010, gross ODA disbursements from bilateral and multilateral agencies) to LDCs has grown by 16%, with much of that momentum coming since 2016. That is the same rate of growth as ODA to other developing countries and substantially below the 49% increase in ODA that doesn’t target specific countries (Figure 11). ODA growth has also been more inconsistent for LDCs, with negative growth or stagnation for several years prior to 2016.
Figure 11: ODA has not grown faster to LDCs than other countries, and non-country specific ODA has grown much faster than both
Growth in ODA to LDCs, other developing countries and non-country-specific ODA, 2010–2019
|
Volume,
US$ millions, constant 2018 prices |
Label | 2010 | 2011 | 2012 | 2013 | 2014 | 2015 | 2016 | 2017 | 2018 | 2019 |
|---|---|---|---|---|---|---|---|---|---|---|---|
| LDC | ODA to LDCs | 46606.15482 | 45578.73 | 42352.08 | 50795.44 | 43819.86 | 46227.25 | 46237.23 | 51357.38 | 51000.51 | 53863.9 |
| Other developing countries | ODA to other developing countries | 58525.43186 | 61404.14 | 60995.37 | 62900.23 | 64103.26 | 67153.38 | 71689.13 | 72746.92 | 67899.81 | 68180.85 |
| Non-country specific ODA | Non-country specific ODA | 36356.58817 | 35576.95 | 36150.49 | 37879.85 | 42284.12 | 49997.12 | 56178.63 | 55461.17 | 53433.68 | 54039.86 |
| Percentage change since 2010 | Label | 2010 | 2011 | 2012 | 2013 | 2014 | 2015 | 2016 | 2017 | 2018 | 2019 |
| LDC | ODA to LDCs | 0% | -2% | -9% | 9% | -6% | -1% | -1% | 10% | 9% | 16% |
| Other developing countries | ODA to other developing countries | 0% | 5% | 4% | 7% | 10% | 15% | 22% | 24% | 16% | 16% |
| Non-country specific ODA | Non-country specific ODA | 0% | -2% | -1% | 4% | 16% | 38% | 55% | 53% | 47% | 49% |
Source: Development Initiatives based on data from the OECD DAC.
Notes: LDC: least developed country; ODA: official development assistance.
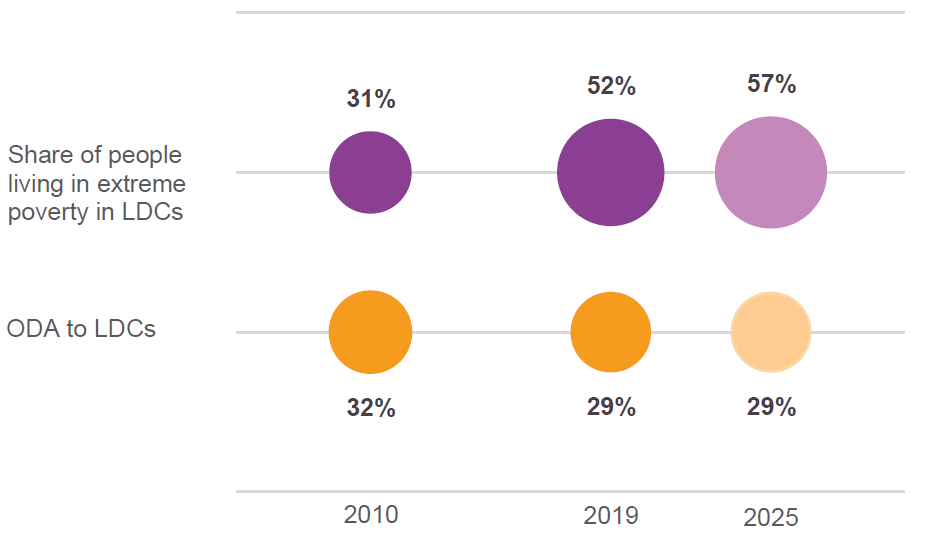
Over this period ODA allocations have not adapted to reflect changing distributions of poverty (Figure 12). LDCs represent an increasing proportion of the world’s poorest people, rising from 31% to 50% of global poverty over the last decade. Yet the share of total ODA has fallen from 32% to 29%. Recognition of the imbalance between needs and assistance has led to calls for increased allocations to LDCs on both equity and efficiency grounds. [36] A failure to address this trend will further exacerbate the imbalance in targeting versus need as poverty continues to be concentrated in such countries.
Figure 12: LDCs receive a lower share of ODA than the proportion of extreme poverty they represent; if ODA allocations do not change, this picture will continue to worsen
ODA distribution to LDCs compared with proportion of people living in extreme poverty, 2010, 2019 (estimate) and 2025 (projected)
| Bubble size | Year | Location | |
|---|---|---|---|
|
ODA to LDCs percent of total (country
allocable only) |
32% | 2010 | 3 |
|
ODA to LDCs percent of total (country
allocable only) |
29% | 2019 | 3 |
|
ODA to LDCs percent of total (country
allocable only) as things stand |
29% | 2025 | 3 |
|
Share of people living in extreme poverty
in LDCs |
31% | 2010 | 6 |
|
Share of people living in extreme poverty
in LDCs |
52% | 2019 | 6 |
|
Share of people living in extreme poverty
in LDCs |
57% | 2025 | 6 |
Source: Development Initiatives based on OECD DAC and World Bank PovcalNet.
Notes: ODA excludes humanitarian assistance. The analysis works on the basis that the proportion of flows received by each country is the same in 2025 as in 2016. It applies the resource data to the current and projected poverty rates. LDC: least developed country; ODA: official development assistance.
Volumes of aid to LDCs increased in 2019 to reach US$53.9 billion (the latest year for which complete and verified ODA data with geographic allocation detail is available), up 6% or US$2.9 billion on 2018. This growth, however, was largely driven by humanitarian assistance, which represented close to half of the 2018–2019 increase. Overall growth was driven by multilateral organisations, including the International Development Association, the Asian Development Bank and Gavi, the Vaccine Alliance. [37] Bilateral aid, in comparison, remained relatively unchanged.
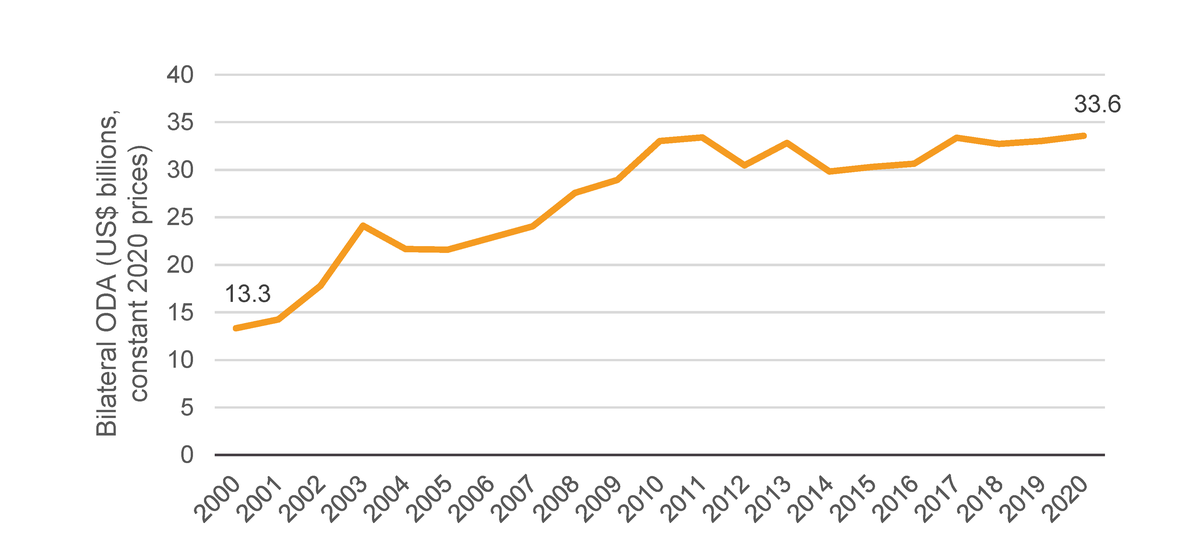
Since the onset of the pandemic, ODA to LDCs has continued to fall behind. ODA provided by Organisation for Economic Co-operation and Development (OECD) Development Assistance Committee (DAC) country donors (i.e. not including assistance disbursed by multilateral agencies, data for which will be published early 2022) increased by 3.5%, interrupting four years of relative stagnation, to reach US$161 billion. Support to LDCs, however, grew by half this rate – 1.8% (Figure 13). [38]
Concessional loans are becoming an increasingly significant modality of ODA. 2020 saw considerable growth in bilateral aid in the form of loans and equity investments, increasing by 28% to US$26.2 billion just as concerns grow about a new debt crisis. It is not yet known what proportion of ODA loans have gone to LDCs in 2020. However, between 2010 and 2019 bilateral ODA loans to LDCs grew five-fold, while grants actually fell by 9%. It is thus likely that this trend will continue and possibly accelerate.
Figure 13: Growth in OECD DAC ODA to LDCs remains modest despite the pandemic
OECD DAC bilateral ODA to LDCs, 2000–2020
| 2000 | 2001 | 2002 | 2003 | 2004 | 2005 | 2006 | 2007 | 2008 | 2009 | 2010 | 2011 | 2012 | 2013 | 2014 | 2015 | 2016 | 2017 | 2018 | 2019 | 2020 | Change 19-20 | Change 11-20 | |
|---|---|---|---|---|---|---|---|---|---|---|---|---|---|---|---|---|---|---|---|---|---|---|---|
|
Net ODA (cashflow basis) with
EU |
13,330 | 14,251 | 17,808 | 24,129 | 21,655 | 21,584 | 22,822 | 24,038 | 27,579 | 28,950 | 33,043 | 33,414 | 30,477 | 32,816 | 29,837 | 30,296 | 30,638 | 33,388 | 32,720 | 33,024 | 33,581 | ||
| 557 | |||||||||||||||||||||||
| 1.7% |
Source: OECD DAC.
Notes: Data on official development assistance (ODA) to least developed countries (LDCs) is available on only a net ODA basis. Germany and Greece failed to report how much of their ODA went to LDCs in 2020 so, in the absence of complete data, this chart assumes that Germany and Greece gave the same proportion of support to LDCs in 2020 as they did in 2019 and applies this proportion to their 2020 net ODA levels. Data refers to bilateral OECD DAC members including EU institutions.
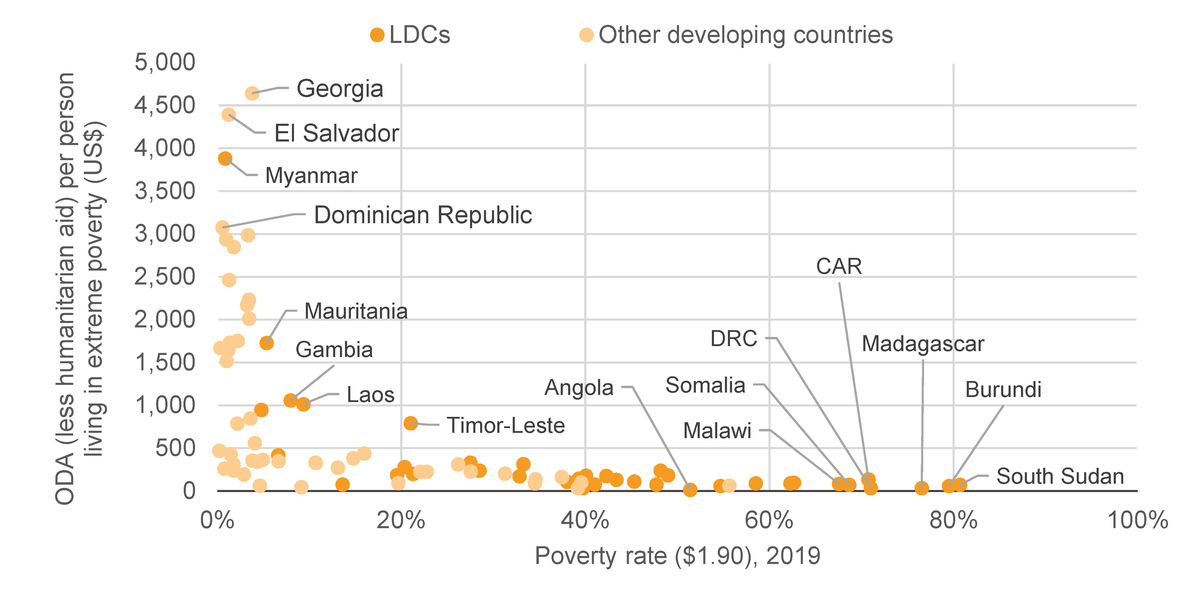
Some of the countries with the highest needs – most of which are LDCs – receive relatively low ODA per capita and low volumes of ODA overall (Figure 14). ODA allocations have been found to be regressive when considering aid per capita living in poverty: countries with government revenues above US$4,000 per capita receive more than three times the ODA per person living in poverty than countries with less than US$400 per capita. [39] Of the 38 LDCs with available data, 31 received below the developing country median estimate of US$331 of ODA per person living in poverty in 2019. A number of LDCs, such as Angola, Madagascar and Burundi also receive relatively little per person living in poverty and in total aggregate terms.
Figure 14: The very poorest countries receive the least ODA per person living in poverty
ODA excluding humanitarian assistance per person living in extreme poverty, 2019
|
Country
name |
ISO Alpha 3 | ISO Alpha 2 | Per poor person | Poverty rate | Total gross less HA | LDC | Labels |
|---|---|---|---|---|---|---|---|
| Afghanistan | AFG | AF | 314.5 | 33% | 3891.42 | 1 | |
| Angola | AGO | AO | 12.3 | 51% | 201.73 | 1 | Angola |
| Bangladesh | BGD | BD | 416.8 | 7% | 4636.59 | 1 | |
| Benin | BEN | BJ | 130.7 | 43% | 669.14 | 1 | |
| Burkina Faso | BFA | BF | 174.0 | 33% | 1160.37 | 1 | |
| Burundi | BDI | BI | 58.9 | 80% | 541.93 | 1 | Burundi |
| Central African Republic | CAF | CF | 133.4 | 71% | 455.45 | 1 | CAR |
| Chad | TCD | TD | 76.2 | 41% | 494.37 | 1 | |
|
Democratic Republic of the
Congo |
COD | CD | 34.4 | 71% | 2116.72 | 1 | DRC |
| Eritrea | ERI | ER | 33.4 | 40% | 70.55 | 1 | |
| Ethiopia | ETH | ET | 185.4 | 20% | 3989.01 | 1 | |
| Gambia | GMB | GM | 1058.9 | 8% | 188.22 | 1 | Gambia |
| Guinea | GIN | GN | 199.3 | 21% | 567.64 | 1 | |
| Guinea-Bissau | GNB | GW | 97.4 | 63% | 119.23 | 1 | |
| Haiti | HTI | HT | 278.6 | 20% | 636.87 | 1 | |
|
Lao People's Democratic
Republic |
LAO | LA | 1012.4 | 9% | 668.74 | 1 | Laos |
| Lesotho | LSO | LS | 239 | 28% | 156.26 | 1 | |
| Liberia | LBR | LR | 238 | 48% | 571.06 | 1 | |
| Madagascar | MDG | MG | 35 | 77% | 713.59 | 1 | Madagascar |
| Malawi | MWI | MW | 83 | 68% | 1105.55 | 1 | Malawi |
| Mali | MLI | ML | 175 | 42% | 1452.69 | 1 | |
| Mauritania | MRT | MR | 1727 | 5% | 430.63 | 1 | Mauritania |
| Mozambique | MOZ | MZ | 89 | 62% | 1747.68 | 1 | |
| Myanmar | MMR | MM | 3882 | 1% | 1828.53 | 1 | Myanmar |
| Nepal | NPL | NP | 948 | 5% | 1356.65 | 1 | |
| Niger | NER | NE | 146 | 39% | 1326.02 | 1 | |
| Rwanda | RWA | RW | 184 | 49% | 1152.8 | 1 | |
| Senegal | SEN | SN | 330 | 27% | 1521.57 | 1 | |
| Sierra Leone | SLE | SL | 180 | 40% | 568.49 | 1 | |
| Somalia | SOM | SO | 71 | 69% | 762.85 | 1 | Somalia |
| South Sudan | SSD | SS | 73 | 81% | 779.5 | 1 | South Sudan |
| Sudan | SDN | SD | 76 | 14% | 440.86 | 1 | |
| Tanzania | TZA | TZ | 75 | 48% | 2189.72 | 1 | |
| Timor-Leste | TLS | TL | 791 | 21% | 225.06 | 1 | Timor-Leste |
| Togo | TGO | TG | 110 | 45% | 408.62 | 1 | |
| Uganda | UGA | UG | 105 | 38% | 1831 | 1 | |
| Yemen | YEM | YE | 59 | 55% | 962.33 | 1 | |
| Zambia | ZMB | ZM | 91 | 59% | 967.24 | 1 | |
| Albania | ALB | AL | 10494 | 1% | 267.88 | ||
| Algeria | DZA | DZ | 1670 | 0% | 228.79 | ||
| Argentina | ARG | AR | 427 | 1% | 280.56 | ||
| Armenia | ARM | AM | 18860 | 1% | 597.63 | ||
| Bolivia | BOL | BO | 2171 | 3% | 800.72 | ||
| Bosnia and Herzegovina | BIH | BA | 281215 | 0% | 580.87 | ||
| Botswana | BWA | BW | 272 | 13% | 84.7 | ||
| Brazil | BRA | BR | 61 | 5% | 594.48 | ||
| Cameroon | CMR | CM | 224 | 23% | 1290.99 | ||
| China (People's Republic of) | CHN | CN | 471 | 0% | 1344.74 | ||
| Colombia | COL | CO | 365 | 5% | 899.73 | ||
| Congo | COG | CG | 61 | 56% | 188.55 | ||
| Costa Rica | CRI | CR | 1518 | 1% | 76.88 | ||
| Côte d'Ivoire | CIV | CI | 224 | 22% | 1264.3 | ||
| Dominican Republic | DOM | DO | 3074 | 1% | 191.15 | Dominican Republic | |
| Ecuador | ECU | EC | 846 | 4% | 518.55 | ||
| Egypt | EGY | EG | 560 | 4% | 2306.3 | ||
| El Salvador | SLV | SV | 4391 | 1% | 354.45 | El Salvador | |
| Equatorial Guinea | GNQ | GQ | 161 | 37% | 82.09 | ||
| Gabon | GAB | GA | 2233 | 3% | 160.94 | ||
| Georgia | GEO | GE | 4641 | 4% | 685.47 | Georgia | |
| Ghana | GHA | GH | 328 | 11% | 1056.06 | ||
| Guatemala | GTM | GT | 350 | 7% | 408.12 | ||
| Honduras | HND | HN | 385 | 15% | 543.95 | ||
| India | IND | IN | 45 | 9% | 5676.28 | ||
| Indonesia | IDN | ID | 193 | 3% | 1499.03 | ||
| Iran | IRN | IR | 264 | 1% | 162.41 | ||
| Iraq | IRQ | IQ | 2464 | 1% | 1250.04 | ||
| Jamaica | JAM | JM | 2846 | 2% | 148.5 | ||
| Jordan | JOR | JO | 216957 | 0% | 2274.78 | ||
| Kazakhstan | KAZ | KZ | 41316 | 0% | 80.95 | ||
| Kenya | KEN | KE | 203 | 31% | 3319.75 | ||
| Kyrgyzstan | KGZ | KG | 10596 | 1% | 365.93 | ||
| Libya | LBY | LY | 90 | 35% | 204.46 | ||
| North Macedonia | MKD | MK | 2987 | 3% | 207.19 | ||
| Malaysia | MYS | MY | 60067 | 0% | 101.01 | ||
| Mauritius | MUS | MU | 39681 | 0% | 63.22 | ||
| Mexico | MEX | MX | 312 | 2% | 719.55 | ||
| Moldova | MDA | MD | 441498 | 0% | 324.49 | ||
| Mongolia | MNG | MN | 50622 | 0% | 385.01 | ||
| Morocco | MAR | MA | 7240 | 1% | 1600.2 | ||
| Namibia | NAM | NA | 438 | 16% | 184.58 | ||
| Nicaragua | NIC | NI | 2011 | 3% | 440.81 | ||
| Nigeria | NGA | NG | 36 | 39% | 2815.9 | ||
| Pakistan | PAK | PK | 343 | 4% | 3006.54 | ||
| Panama | PAN | PA | 1643 | 1% | 84.57 | ||
| Papua New Guinea | PNG | PG | 311 | 26% | 698.78 | ||
| Paraguay | PRY | PY | 2937 | 1% | 194.69 | ||
| Peru | PER | PE | 787 | 2% | 566.84 | ||
| Philippines | PHL | PH | 355 | 4% | 1462.02 | ||
| Serbia | SRB | RS | 229630 | 0% | 742.88 | ||
| South Africa | ZAF | ZA | 94 | 20% | 1075.39 | ||
| Sri Lanka | LKA | LK | 5977 | 1% | 717.69 | Sri Lanka | |
| Eswatini | SWZ | SZ | 228 | 28% | 88.89 | ||
| Syrian Arab Republic | SYR | SY | 136 | 35% | 871.97 | ||
| Tajikistan | TJK | TJ | 1752 | 2% | 359.77 | ||
| Thailand | THA | TH | 7147 | 0% | 390.79 | ||
| Tunisia | TUN | TN | 56494 | 0% | 1459.15 | ||
| Turkey | TUR | TR | 5624 | 0% | 1682.63 | ||
| Turkmenistan | TKM | TM | 239 | 2% | 24.82 | ||
| Ukraine | UKR | UA | 0% | 1161.44 | |||
| Uzbekistan | UZB | UZ | 332 | 11% | 1162.64 | ||
| Viet Nam | VNM | VN | 1732 | 1% | 2282.34 | ||
| West Bank and Gaza Strip | PSE | PS | 30731 | 1% | 1423.03 | ||
| Zimbabwe | ZWE | ZW | 101 | 40% | 692.07 |
Sources: Development Initiatives based on OECD DAC Creditor Reporting System (CRS) and World Bank PovcalNet.
Notes: Countries with populations below 1 million people are not shown on the chart. The vertical axis has been capped at US$5,000. Bubbles represent the volume of gross official development assistance (ODA) less humanitarian assistance in 2019. LDC: least developed country.
An equally important consideration is which donors prioritise LDCs in allocating their ODA, as this has important implications for where future action should be taken and is possible. The overall financing situation in all LDCs could be substantially improved if all OECD DAC donors met the UN target of 0.15–0.20% of GNI as ODA to LDCs, which only five DAC donors currently do (Luxembourg, Sweden, Norway, Denmark and the UK). If all donors had met this target in 2019 an additional US$35–60 billion would have been mobilised – the top end of that range is roughly equivalent to all ODA to LDCs in the same year.
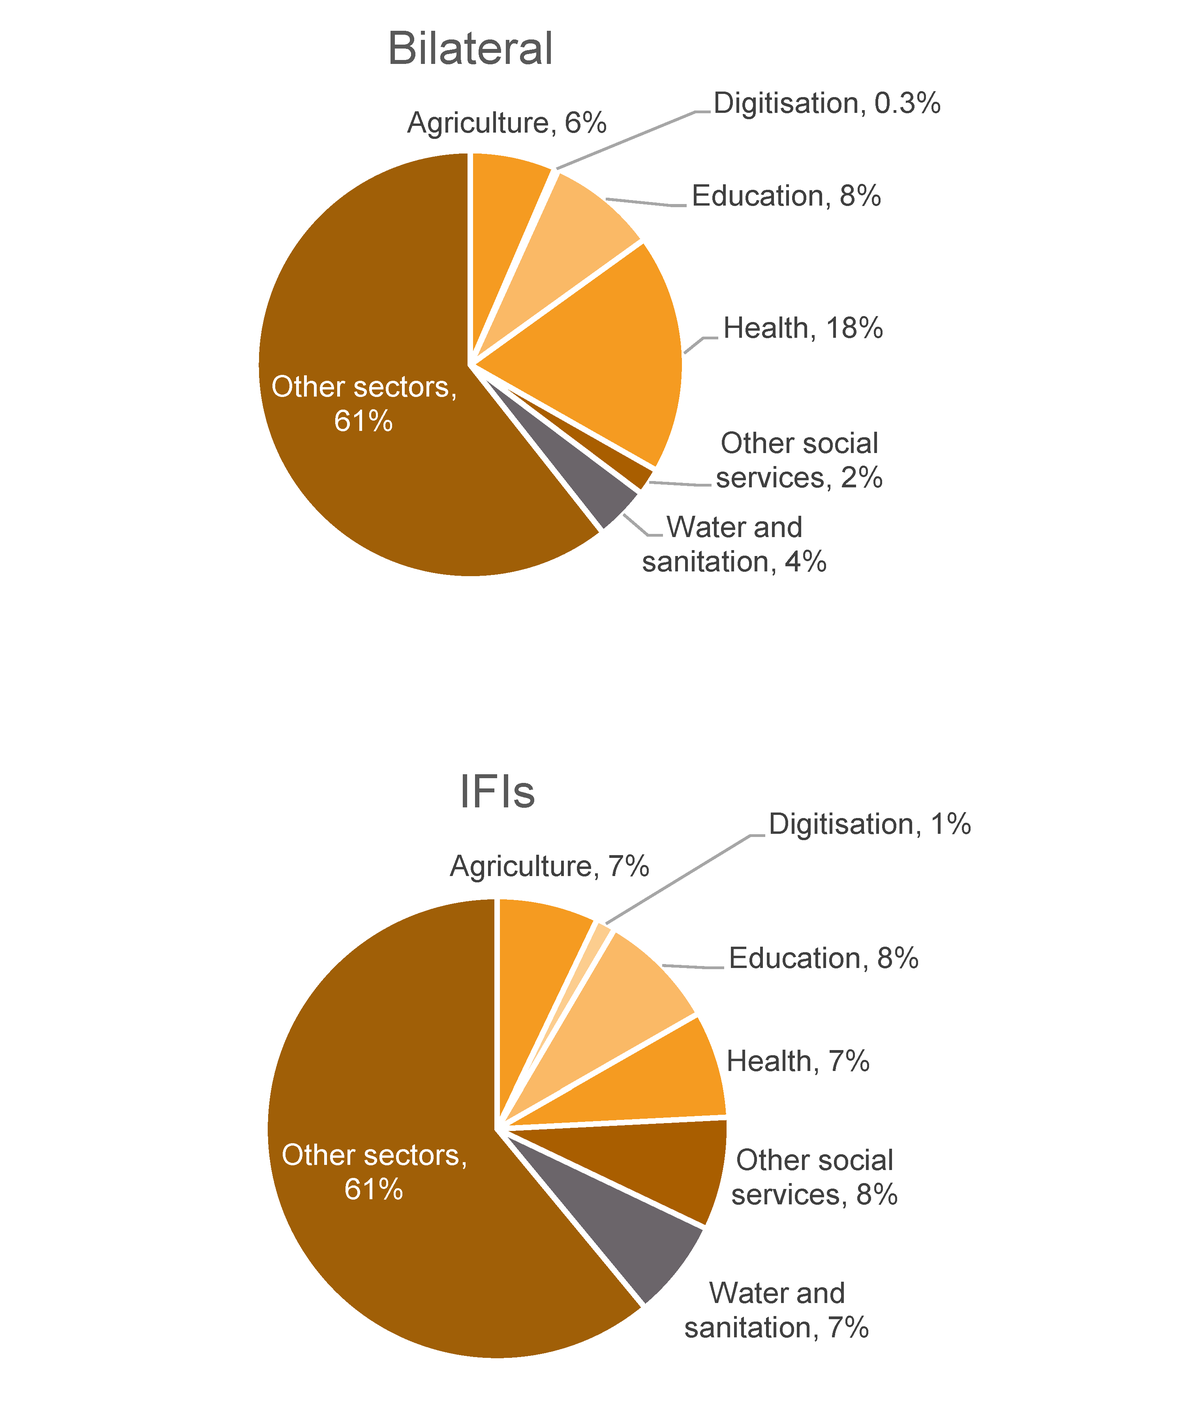
Looking at how ODA has been targeted to key sectors provides important context for understanding the overall impact of ODA in supporting the people living in greatest poverty in LDCs. Some sectors (and critical components of those sectors) are broadly accepted, based on an existing body of evidence, as being critical foundations for human capital and development. [40] While many types of investment and sectors can all play important and supportive roles in development and poverty reduction, some sectors are particularly critical to the people living in greatest poverty in that their impact disproportionately accrues to those living in extreme poverty. These include health, education, agriculture, digitalisation, water and sanitation, social protection and cross-cutting issues such as climate resilience and gender. While these clearly form a large part of ODA to LDCs, both before and during the pandemic, they do not form the majority and, given the transformative role they can play in poverty eradication and human capital development, greater investment may be needed (Figure 15).
Figure 15: Sectors that most benefit the people living in greatest poverty receive less than half of ODA in LDCs
Sectoral allocation in LDCs, 2015–2019
| 2015-2019 | 2015-2019 | 2015-2019 | 2015-2019 | |
|---|---|---|---|---|
| Sector | Bilateral | IFI | Bilateral | IFI |
| Agriculture | 8810.1 | 4400.6 | 6% | 7% |
| Digitisation | 404.8 | 848.1 | 0% | 1% |
| Education | 11311.5 | 5129.1 | 8% | 8% |
| Health | 24759.9 | 4628.7 | 18% | 7% |
| Other social services | 2791.8 | 4893.7 | 2% | 8% |
| Water and sanitation | 5579.8 | 4294.4 | 4% | 7% |
| Other sectors | 82654.3 | 37828.9 | 61% | 61% |
| Total | 136312.1 | 62023.4 | 100% | 100% |
Sources: Development Initiatives based on OECD DAC Creditor Reporting System (CRS).
Notes: IFI: international financial institution; LDC: least developed country; ODA: official development assistance.
Many of the largest IFIs have prioritised these sectors during the pandemic, however their commitments have come primarily as loans which, considering the growing debt distress in LDCs and very high and growing levels of debt service, will have long-term costs.
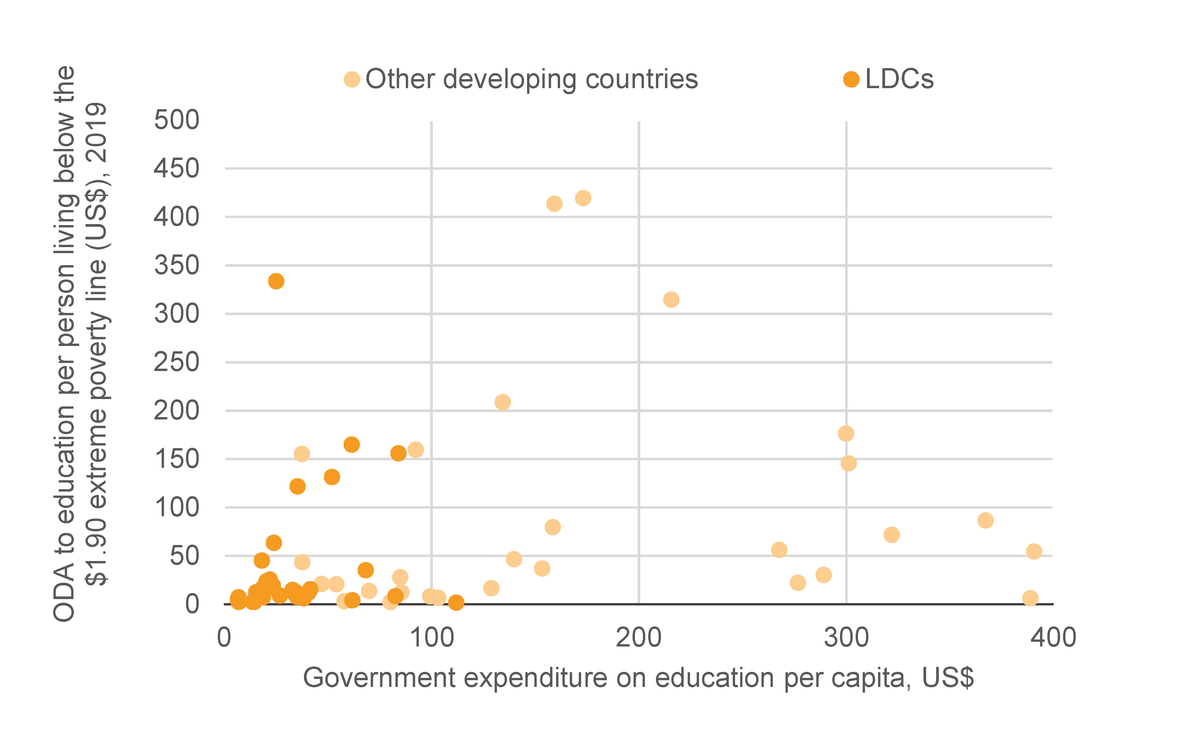
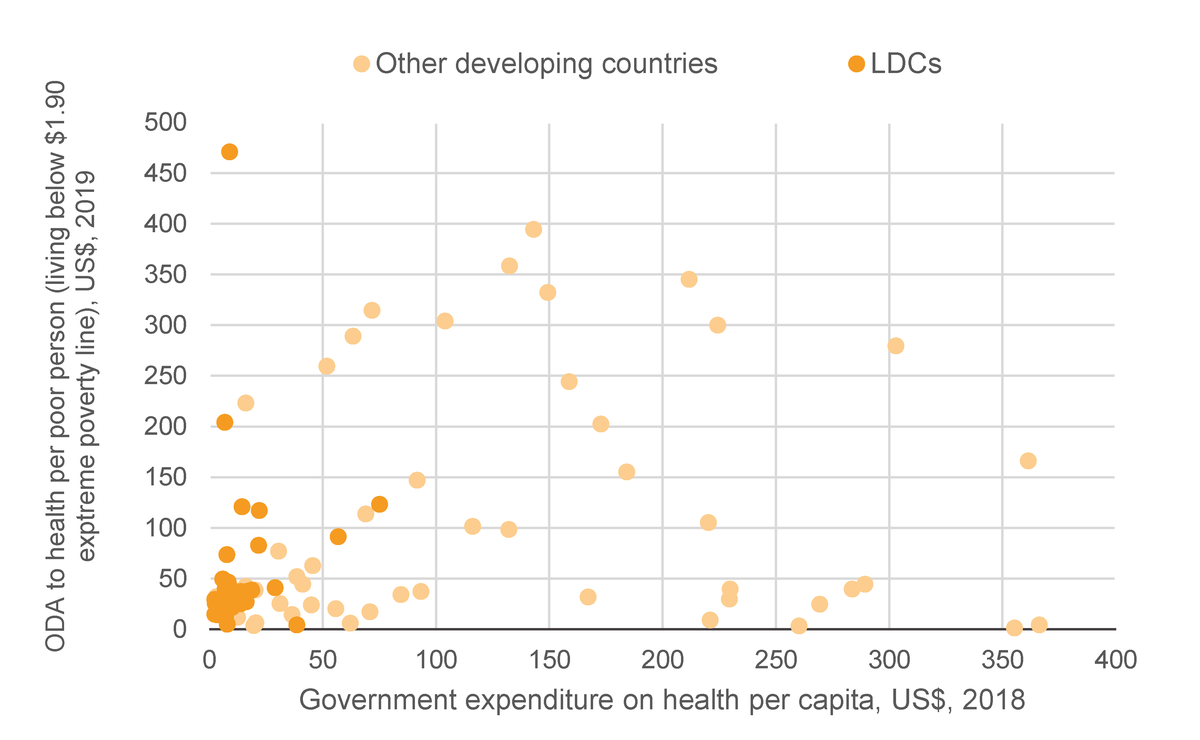
But the targeting of ODA to the places in greatest need of financing in these sectors remains problematic. For neither education (Figure 16) nor health (Figure 17) is there a strong correlation between low capacity to finance domestically and ODA allocation. Rather the opposite is true, and as LDCs make up most of the countries with low financing capacity, they also see a disproportionately low allocation of ODA to support these priorities.
Figure 16: ODA to education is not targeting the countries with the least ability to self-finance
ODA to education compared with government expenditure in LDCs and other developing countries, latest year for which there is data
| Country name | ISO Alpha 3 | ODA to education per poor person | Government spending on education per-capita | LDC |
|---|---|---|---|---|
| Afghanistan | AFG | 23.94376 | 20.50789 | 1 |
| Angola | AGO | 1.634378 | 111.9059 | 1 |
| Bangladesh | BGD | 63.7156 | 24.08636 | 1 |
| Benin | BEN | 10.48897 | 34.38582 | 1 |
| Burkina Faso | BFA | 12.03137 | 40.60855 | 1 |
| Burundi | BDI | 2.468677 | 13.87059 | 1 |
| Central African Republic | CAF | 7.14733 | 6.989641 | 1 |
| Chad | TCD | 7.465576 | 16.96909 | 1 |
| Democratic Republic of the Congo | COD | 2.323715 | 7.112629 | 1 |
| Eritrea | ERI | 1 | ||
| Ethiopia | ETH | 11.98533 | 35.06441 | 1 |
| Gambia | GMB | 45.2174 | 18.19654 | 1 |
| Guinea | GIN | 16.99747 | 22.75136 | 1 |
| Guinea-Bissau | GNB | 12.41252 | 15.42214 | 1 |
| Haiti | HTI | 25.47757 | 22.02394 | 1 |
| Lao People's Democratic Republic | LAO | 165.0648 | 61.49578 | 1 |
| Lesotho | LSO | 8.352696 | 82.59229 | 1 |
| Liberia | LBR | 17.46222 | 18.86396 | 1 |
| Madagascar | MDG | 2.356651 | 14.53551 | 1 |
| Malawi | MWI | 7.874145 | 17.53156 | 1 |
| Mali | MLI | 14.75872 | 32.99784 | 1 |
| Mauritania | MRT | 122.0091 | 35.499 | 1 |
| Mozambique | MOZ | 9.119242 | 26.93039 | 1 |
| Myanmar | MMR | 333.6569 | 25.10219 | 1 |
| Nepal | NPL | 131.6508 | 52.0753 | 1 |
| Niger | NER | 13.64549 | 19.27042 | 1 |
| Rwanda | RWA | 19.31947 | 23.50645 | 1 |
| Senegal | SEN | 35.13056 | 68.26083 | 1 |
| Sierra Leone | SLE | 15.53221 | 41.52234 | 1 |
| Somalia | SOM | 1 | ||
| South Sudan | SSD | 5.089425 | 6.681136 | 1 |
| Sudan | SDN | 1 | ||
| Tanzania | TZA | 6.217555 | 38.42944 | 1 |
| Timor-Leste | TLS | 156.1691 | 84.1774 | 1 |
| Togo | TGO | 7.680306 | 35.28599 | 1 |
| Uganda | UGA | 7.383392 | 18.77161 | 1 |
| Yemen | YEM | 1 | ||
| Zambia | ZMB | 4.079017 | 61.8741 | 1 |
| Albania | ALB | 1847.502 | 180.4835 | |
| Algeria | DZA | |||
| Argentina | ARG | 45.8739 | 502.3618 | |
| Armenia | ARM | 935.0832 | 109.7786 | |
| Bolivia | BOL | |||
| Bosnia and Herzegovina | BIH | |||
| Botswana | BWA | |||
| Brazil | BRA | 10.50465 | 548.7048 | |
| Cameroon | CMR | 21.1566 | 47.08684 | |
| China (People's Republic of) | CHN | |||
| Colombia | COL | 30.30088 | 289.109 | |
| Congo | COG | 8.34173 | 99.44166 | |
| Costa Rica | CRI | 259.2223 | 863.1016 | |
| Côte d'Ivoire | CIV | 13.81797 | 69.92519 | |
| Dominican Republic | DOM | |||
| Ecuador | ECU | 71.9353 | 321.9405 | |
| Egypt | EGY | |||
| El Salvador | SLV | 887.9924 | 147.6664 | |
| Equatorial Guinea | GNQ | |||
| Gabon | GAB | 314.8693 | 215.6867 | |
| Georgia | GEO | 413.816 | 159.2908 | |
| Ghana | GHA | 28.0185 | 84.93426 | |
| Guatemala | GTM | 46.54331 | 139.872 | |
| Honduras | HND | 37.09763 | 153.4078 | |
| India | IND | 3.236567 | 57.94683 | |
| Indonesia | IDN | 16.46346 | 128.8436 | |
| Iran | IRN | 176.5211 | 299.8422 | |
| Iraq | IRQ | |||
| Jamaica | JAM | 145.6706 | 301.2011 | |
| Jordan | JOR | 30357.97 | 135.9785 | |
| Kazakhstan | KAZ | 13848.54 | 280.8896 | |
| Kenya | KEN | 6.553527 | 103.3304 | |
| Kyrgyzstan | KGZ | 1334.918 | 76.77795 | |
| Libya | LBY | |||
| North Macedonia | MKD | |||
| Malaysia | MYS | 17200.64 | 465.9921 | |
| Mauritius | MUS | 8812.21 | 523.2631 | |
| Mexico | MEX | 28.00915 | 447.5993 | |
| Moldova | MDA | 34128.94 | 272.4604 | |
| Mongolia | MNG | 9642.235 | 158.1174 | |
| Morocco | MAR | |||
| Namibia | NAM | 54.46483 | 390.598 | |
| Nicaragua | NIC | 159.6853 | 92.53188 | |
| Nigeria | NGA | |||
| Pakistan | PAK | 43.52684 | 37.73654 | |
| Panama | PAN | 86.75455 | 367.1773 | |
| Papua New Guinea | PNG | 20.80305 | 54.17928 | |
| Paraguay | PRY | 419.6599 | 173.1377 | |
| Peru | PER | 56.18666 | 267.6907 | |
| Philippines | PHL | |||
| Serbia | SRB | 16858.17 | 253.3495 | |
| South Africa | ZAF | 6.362049 | 388.8686 | |
| Sri Lanka | LKA | 511.5207 | 80.49959 | |
| Eswatini | SWZ | 22.27298 | 276.7146 | |
| Syrian Arab Republic | SYR | |||
| Tajikistan | TJK | 155.4258 | 37.61161 | |
| Thailand | THA | 707.9246 | 275.2703 | |
| Tunisia | TUN | 7373.671 | 212.1132 | |
| Turkey | TUR | |||
| Turkmenistan | TKM | 79.84978 | 158.5055 | |
| Ukraine | UKR | |||
| Uzbekistan | UZB | 12.52511 | 85.55496 | |
| Viet Nam | VNM | 208.9227 | 134.3103 | |
| West Bank and Gaza Strip | PSE | |||
| Zimbabwe | ZWE | 2.63795 | 80.22964 |
Sources: Development Initiatives based on OECD DAC Creditor Reporting System (CRS) and UNESCO.
Notes: Countries with populations below 1 million people are not shown on the chart. The vertical axis has been capped at US$500 and the horizontal axis at US$400. Year based on latest available data for each country. LDC: least developed country; ODA: official development assistance.
Figure 17: ODA to health is not targeting the countries with the least ability to self-finance
ODA to health compared with government expenditure in LDCs and other developing countries, latest year for which there is data
| Country name | ISO Alpha 3 | ODA to health per poor person | Government spending on health per-capita |
|---|---|---|---|
| Afghanistan | AFG | 25.88585 | 2.634632 |
| Angola | AGO | 4.473949 | 38.69627 |
| Bangladesh | BGD | 39.92415 | 6.964723 |
| Benin | BEN | 22.77956 | 6.088112 |
| Burkina Faso | BFA | 37.67345 | 17.10854 |
| Burundi | BDI | 20.71569 | 5.894713 |
| Central African Republic | CAF | 22.02178 | 3.36089 |
| Chad | TCD | 17.56764 | 4.970882 |
| Democratic Republic of the Congo | COD | 14.91056 | 2.46923 |
| Eritrea | ERI | 14.25579 | 3.703422 |
| Ethiopia | ETH | 33.82368 | 6.568487 |
| Gambia | GMB | 204.1531 | 6.778625 |
| Guinea | GIN | 49.54546 | 5.882589 |
| Guinea-Bissau | GNB | 24.69104 | 5.265614 |
| Haiti | HTI | 73.79862 | 7.696828 |
| Lao People's Democratic Republic | LAO | 117.1476 | 22.09848 |
| Lesotho | LSO | 123.3931 | 75.10368 |
| Liberia | LBR | 37.20771 | 12.33968 |
| Madagascar | MDG | 5.08326 | 7.895077 |
| Malawi | MWI | 33.15798 | 9.431566 |
| Mali | MLI | 30.60299 | 10.14827 |
| Mauritania | MRT | 83.07044 | 21.68358 |
| Mozambique | MOZ | 28.08144 | 8.287423 |
| Myanmar | MMR | 471.1749 | 8.990345 |
| Nepal | NPL | 120.8649 | 14.49318 |
| Niger | NER | 21.66663 | 10.07901 |
| Rwanda | RWA | 38.73585 | 18.66114 |
| Senegal | SEN | 37.24379 | 14.00067 |
| Sierra Leone | SLE | 46.41411 | 8.331848 |
| Somalia | SOM | ||
| South Sudan | SSD | 29.57384 | 2.441784 |
| Sudan | SDN | 25.1549 | 13.74672 |
| Tanzania | TZA | 27.21458 | 16.28706 |
| Timor-Leste | TLS | 91.27981 | 56.8194 |
| Togo | TGO | 12.71645 | 7.129945 |
| Uganda | UGA | 37.58919 | 7.51614 |
| Yemen | YEM | ||
| Zambia | ZMB | 41.00227 | 28.99638 |
| Albania | ALB | 332.3271 | 149.3036 |
| Algeria | DZA | 31.80458 | 167.0666 |
| Argentina | ARG | 4.710126 | 690.5338 |
| Armenia | ARM | 259.7138 | 51.80728 |
| Bolivia | BOL | 244.5035 | 158.7277 |
| Bosnia and Herzegovina | BIH | 2485.25 | 376.9652 |
| Botswana | BWA | 166.0573 | 361.3646 |
| Brazil | BRA | 1.247428 | 355.1913 |
| Cameroon | CMR | 32.26762 | 3.269643 |
| China (People's Republic of) | CHN | 44.41494 | 289.2167 |
| Colombia | COL | 4.541158 | 366.2204 |
| Congo | COG | 6.437306 | 20.55451 |
| Costa Rica | CRI | 33.97231 | 655.59 |
| Côte d'Ivoire | CIV | 38.73132 | 20.27451 |
| Dominican Republic | DOM | 345.4509 | 211.6898 |
| Ecuador | ECU | 24.69838 | 269.3867 |
| Egypt | EGY | 14.58144 | 36.56325 |
| El Salvador | SLV | 155.3772 | 184.2144 |
| Equatorial Guinea | GNQ | 6.005512 | 62.19813 |
| Gabon | GAB | 98.49697 | 132.0919 |
| Georgia | GEO | 358.6486 | 132.4455 |
| Ghana | GHA | 77.01478 | 30.51956 |
| Guatemala | GTM | 37.50978 | 93.4041 |
| Honduras | HND | 17.49247 | 70.84876 |
| India | IND | 3.615129 | 19.63182 |
| Indonesia | IDN | 20.41532 | 55.82166 |
| Iran | IRN | 9.18919 | 220.9091 |
| Iraq | IRQ | 101.8055 | 116.1688 |
| Jamaica | JAM | 300.091 | 224.2447 |
| Jordan | JOR | 7485.354 | 163.3596 |
| Kazakhstan | KAZ | 5166.465 | 167.1243 |
| Kenya | KEN | 44.57851 | 41.16159 |
| Kyrgyzstan | KGZ | 1071.126 | 36.99965 |
| Libya | LBY | ||
| North Macedonia | MKD | 30.01346 | 229.426 |
| Malaysia | MYS | 3329.304 | 212.8885 |
| Mauritius | MUS | 1010.701 | 282.165 |
| Mexico | MEX | 3.297195 | 260.1738 |
| Moldova | MDA | 23751.63 | 156.2783 |
| Mongolia | MNG | 8361.411 | 89.10428 |
| Morocco | MAR | 314.6651 | 71.86081 |
| Namibia | NAM | 105.5427 | 220.2476 |
| Nicaragua | NIC | 304.2626 | 104.0245 |
| Nigeria | NGA | 12.03205 | 12.45121 |
| Pakistan | PAK | 42.65678 | 16.08953 |
| Panama | PAN | 72.71569 | 726.2637 |
| Papua New Guinea | PNG | 62.99645 | 45.62144 |
| Paraguay | PRY | 202.6289 | 172.7984 |
| Peru | PER | 39.73977 | 229.8572 |
| Philippines | PHL | 24.01863 | 44.96015 |
| Serbia | SRB | 8646.039 | 367.32 |
| South Africa | ZAF | 39.78697 | 283.5589 |
| Sri Lanka | LKA | 289.2725 | 63.38817 |
| Eswatini | SWZ | 147.2032 | 91.73163 |
| Syrian Arab Republic | SYR | ||
| Tajikistan | TJK | 223.42 | 16.17395 |
| Thailand | THA | 653.7433 | 210.4501 |
| Tunisia | TUN | 394.5377 | 143.1473 |
| Turkey | TUR | 279.5816 | 302.9233 |
| Turkmenistan | TKM | 34.37737 | 84.55606 |
| Ukraine | UKR | 115.3967 | |
| Uzbekistan | UZB | 25.65846 | 31.22763 |
| Viet Nam | VNM | 113.9098 | 69.10858 |
| West Bank and Gaza Strip | PSE | ||
| Zimbabwe | ZWE | 52.05021 | 38.70453 |
Sources: Development Initiatives based on OECD DAC Creditor Reporting System (CRS) and WHO Global Health Expenditure Database.
Notes: Countries with populations below 1 million people are not shown on the chart. The vertical axis has been capped at US$500 and the horizontal axis at US$400. LDC: least developed country; ODA: official development assistance.
Per person living in poverty, the current distribution to education sees most LDCs receiving low levels of ODA, particularly those with the lowest government spending on education. Of the 38 LDCs shown on the chart, 31 receive below the developing country median estimate of US$36.1 of education ODA per person living in poverty in 2019. The same is true for health where, of the 38 LDCs shown, 26 receive below the estimate of US$39.8 of health ODA per person living in poverty in 2019.
ODA is a vital resource in LDCs and, with falls in other important sources of finance, it will be a key part of a sustainable recovery from the pandemic. But there are serious challenges and gaps in how ODA is allocated and used, notably in targeting scarce ODA resources to the countries facing the biggest challenges both before and after Covid-19.
Conclusion
The consequences of the pandemic for the poorest countries will be longer and deeper, even if the more immediate effects have not seemed as large in an absolute sense.
Poverty will fall more slowly and remain much higher in LDCs, resulting in increased concentrations of poverty incidence in many of these countries. For people already barely getting by, even a small hit is significant. Lost education and reduced access to healthcare and income are among the many impacts on people’s lives and livelihoods that have made an already fragile existence even less sustainable.
Finance to meet these growing needs has taken a serious hit – and again LDCs are disproportionately affected. The decline in domestic resources, so vital to development, and the other resources on which LDCs rely paints a bleak financing picture. This will not only have immediate effects as countries are less able to finance stimulus or lifeline programmes but also have long-term effects on sustainable development as they lack the capacity to support vital sectors and interventions, such as healthcare and education.
If all donors met the UN target for ODA to LDCs, substantial additional resources could be mobilised, equal to that provided in 2019. ODA has the potential to act as a counter to these negative forces but is also facing challenges and concerning trends. In aggregate, ODA to LDCs has historically been larger than other international private flows such as FDI, remittances and tourism flows, and has a comparative advantage in its ability to target poverty directly. ODA to LDCs had been growing before the pandemic but at the same rate as to other developing countries. Effective targeting of this scarce resource to the places of greatest need can be significantly improved; currently less than a quarter of ODA goes to the countries with the highest poverty rates, mostly LDCs. The same is true when looking at the sectors most critical to people living in poverty – where targeting to support access to health or education, for example, is poorly aligned to need and low capacity to self-finance.
By any measure, this leaves LDCs on average well off-track to meet the SDGs, with large numbers of people still living in extreme poverty and a growing divergence between LDCs and the rest of the world. This is the exact opposite of what was promised in the SDGs and before the Covid-19 pandemic.
As the international community prepares for the fifth LDC conference in the wake of this most acute and severe crisis, there is an opportunity to shift this trajectory.
Appendix: Methodology
Poverty forecasting is conducted by drawing on the World Bank’s PovcalNet distribution data for each country. The distributions are forecasted by taking the IMF’s World Economic Outlook GDP growth numbers multiplied by 87%, which the World Bank has identified as the average rate at which GDP growth has translated to income/consumption growth. The PovcalNet data was taken from the March 2021 update and the World Economic Outlook was updated in April 2021.
Data on FDI is downloaded from UNCTADStat for years up to 2019. Data for 2020 is then estimated using data on the percentage change between 2019 and 2020. For certain countries, this growth rate is scraped from UNCTAD’s Investment Trends Monitor . This report also gives growth rate projections for a number of country groupings. Using these grouping projections, DI estimates the growth rate data for the countries that are not named in the report.
Data on remittances is downloaded from the World Bank for years up to 2020, as is data on the transaction fees associated with sending remittances. The latter is subtracted from the former, giving net remittance data. Data for 2021 is estimated using growth rates for country groupings, which are scraped from the KNOMAD report Phase II: COVID-19 Crisis through a Migration Lens , and are applied to individual countries within each grouping.
Data on tourism is downloaded from the World Bank’s World Development Indicators for years up to 2019. Data for 2020 and 2021 is estimated using scraped data on certain countries from UNWTO on the changes in tourism receipts and arrivals.
Notes
-
1
Extreme poverty is defined as living on less than $1.90 a day per capita in 2011 PPP. Development Initiatives based on World Bank's PovcalNet and International Monetary Fund's World Economic Outlook, updated from Development Initiatives, 2020. How is Covid impacting people living in poverty worldwide? Available at /resources/covid-impacting-people-living-poverty-worldwide/?nav=more-aboutReturn to source text
-
2
UN, 2021. World Economic Situation and Prospects 2021. Available at: www.un.org/en/world-economic-situation-and-prospects-2021Return to source text
-
3
International Monetary Fund (IMF), 2021. The Great Divergence: A Fork in the Road for the Global Economy. Available at: https://blogs.imf.org/2021/02/24/the-great-divergence-a-fork-in-the-road-for-the-global-economyReturn to source text
-
4
UN, 2019. The Sustainable Development Goals Report 2019. Available at: https://unstats.un.org/sdgs/report/2019/The-Sustainable-Development-Goals-Report-2019.pdfReturn to source text
-
5
UN, 2019. Financing for Sustainable Development Report 2019. Available at: https://developmentfinance.un.org/fsdr2019Return to source text
Related content
Donors at the triple nexus
DI Senior Policy & Engagement Advisor Sarah Dalrymple presents some of our recent analysis into how donors like Sweden and the UK are approaching the triple nexus between humanitarian, development and peace approaches in crisis contexts.
Implications of coronavirus on financing for sustainable development
DI Executive Director Harpinder Collacott summarises the possible impacts of the coronavirus pandemic on global development - including projections for extreme poverty, the future of different forms of financing, and the countries likely to be most impacted.
What do emerging trends in development finance mean for crisis actors?
DI's webinar ‘What do emerging trends in development finance mean for crisis actors?’ gives crisis actors key information on development finance to better understand what it means for them.
