Status of disability in Kenya: Statistics from the 2019 census
Accurate census figures can support inclusion of people with disabilities, but what do the figures tell us about disability in Kenya, and how accurate are they?
DownloadsIntroduction
Kenya Population and Housing Census
In August 2019 Kenya conducted its eighth Population and Housing Census. Data provided by the census is vital for the government, private sector and civil society to design and target disability-inclusive policies and programmes. Census data is also a critical input in the response to coronavirus, as it can support mapping of vulnerable communities and the distribution of funding to ensure public safety, health facilities, and social and economic protections for people with disabilities. The production of accurate and publicly accessible census data is therefore critical for efforts aimed at improving disability inclusion.
Preliminary reports
Microdata from the 2019 census has not yet been published, but in November 2019 and February 2020 a series of preliminary census reports were released by the Kenya National Bureau of Statistics (KNBS). [1] These preliminary census reports provide summary tables of statistics drawn from the census data. In this paper we present an initial analysis of Kenya’s 2019 disability statistics using data sourced from these reports.
The 2019 census demonstrates the progress Kenya is making towards disability-inclusive data collection by integrating internationally comparable questions for identifying people with disabilities. This background paper provides a quantitative analysis of Kenya’s disability demographics, including disability prevalence rates at the national and subnational levels and by domain, and a critical appraisal of the factors that may have contributed to the results.
Future data
As further census reports and microdata are published by KNBS, we will conduct additional analyses disaggregating disability statistics by socioeconomic characteristics such as education, health and participation in economic activities.
Counting people with disabilities
Difficulties with disability statistics
Generating accurate statistics on disability can be challenging due to the lack of universally accepted standards for categorising disabilities and methods for collecting data that navigate potential issues of stigma. Adopting one common system of data collection allows for accurate comparison of disability data over time and across locations; however, Kenya’s past censuses and surveys have used a variety of data collection questions and methodologies. [2] Development Initiatives’ 2019 assessment of the quantity, quality, frequency and availability of official disability data demonstrated Kenya’s wide range of disability statistics, all of which record significantly lower disability prevalence compared with the global 15% prevalence rate estimated by the World Health Organization. [3]
The challenges of accurately measuring disability demographics have been long recognised in Kenya. Organisations of people with disabilities (DPOs) critique the 2009 census (which recorded a disability prevalence rate of 3.5%) as significantly underrepresenting the number of people with disabilities. [4]
Use of standards to guide disability data collection
In the preparatory stages of the 2019 census, DPOs, led by the United Disabled Persons of Kenya (UDPK), advocated for the use of UN-recommended standards to guide the collection of data on disability. These standards – the Washington Group Questions – were used in the 2019 census to identify people with disabilities.
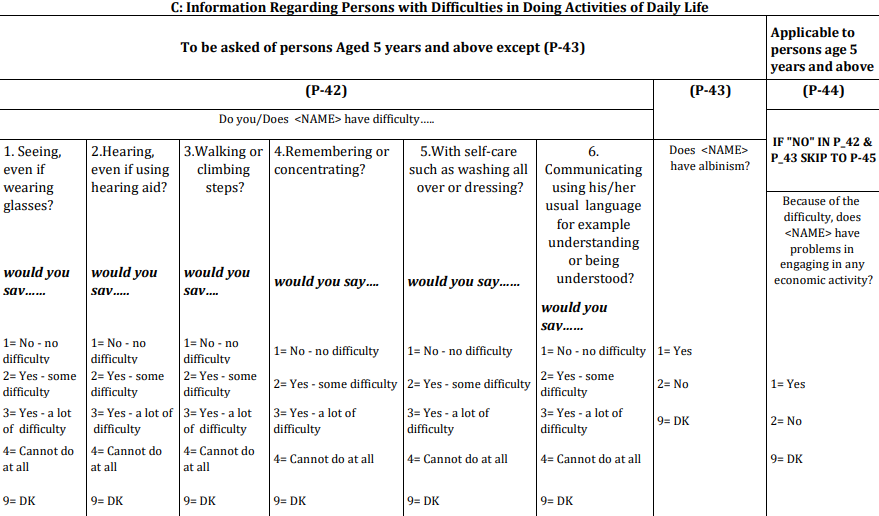
The Washington Group Short Set of Questions are designed to identify people who experience difficulties in doing six universal, basic actions – seeing, hearing, mobility, cognition, self-care and communication. The questions ask respondents to choose from four levels of difficulty for each domain: 1) No, no difficulty 2) Yes, some difficulty 3) Yes, a lot of difficulty, 4) Cannot do it at all. In the census an option for ‘Don’t know’ was also included. This question framework captures both domain of functioning and severity of functioning across the population.
In addition to the Washington Group Questions, the census included questions on albinism and its impact on engagement in economic activity.
Disability data collection in the 2019 census
Disability data in the 2019 census was collected for adults and children above five years of age. Following the standard practice of the Washington Group Questions in their analysis of disability prevalence, KNBS included those who responded to the six questions with ‘Yes, a lot of difficulty’ or ‘Cannot do it at all’. [5]
It was Kenya’s first paperless census and, in accordance with the UN census recommendations, adopted technology for data collection, enumeration and mapping of respondents. [6] To facilitate inclusiveness, during census preparations KNBS consulted with civil society organisations on the disability questions and the training of enumerators. Furthermore, the enumerators, supervisors and other KNBS staff underwent training on sensitivity of the disability questions, language translation and capacity to ask the Washington Group Questions.
Disability statistics in Kenya
Demographics and intercensal comparison
According to the 2019 census, 2.2% (0.9 million people) of Kenyans live with some form of disability. Direct comparison of disability prevalence in 2009 and 2019 is problematic due to differences in data collection methodologies, ages covered and size of administrative units. The 2019 census appears to show a sharp drop in disability prevalence; the 2009 census states 3.5%, but when looking at the same age threshold (i.e. adults and children above five years of age) the 2009 disability prevalence rate was 3.8%.
The 2019 census indicates that 1.9% of men have a disability compared with 2.5% of women. For comparison, the 2009 census reported 3.4% of men and 3.5% of women had a disability; again, when looking at the same age threshold (i.e. adults and children above five years of age), 3.7% of men and 3.9% of women had a disability (Figure 2). [7]
There are more people with disabilities living in rural than urban areas. Analysis of prevalence rates by residence shows 2.6% (0.7 million) of people in rural areas and 1.4% (0.2 million) of people in urban areas have a disability. The 2009 census reports 3.8% of rural populations and 3.1% of urban populations had a disability (Figure 2).
Figure 2: Intercensal comparison of disability prevalence rates by gender
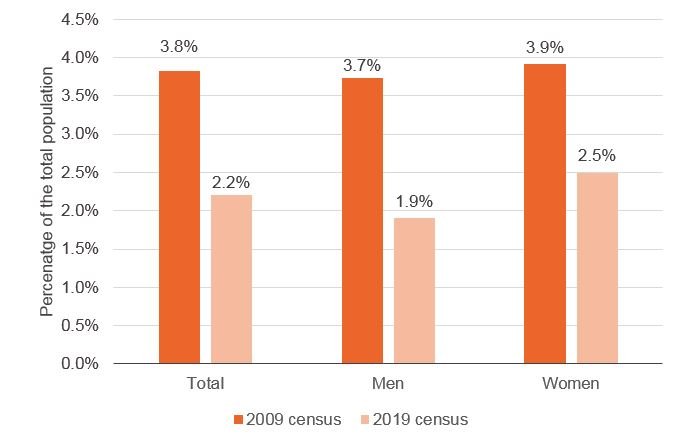
The 2019 census recorded 2.2 percent of the population above five years of age had a disability, whereas the 2009 census recorded 3.8 percent. In 2019 1.9 percent of men and 2.5 percent of women had a disability, while in 2009 3.7 percent of men and 3.9 percent of women had a disability.
Source: Development Initiatives based on KNBS
Note: Prevalence rates use different methodological frameworks and are not directly comparable.
Disability by domain
Analysis of disability by domain reveals that mobility is the most commonly reported difficulty, experienced by 0.4 million Kenyans and representing 42% of people with disabilities. The other domains of disability – seeing, hearing, cognition, self-care and communication – are experienced by between 36% and 12% of people with disabilities. Albinism is a condition experienced by 0.02% of Kenya’s population (Figure 3).
Figure 3: Numbers of Kenyan people disability, by domain
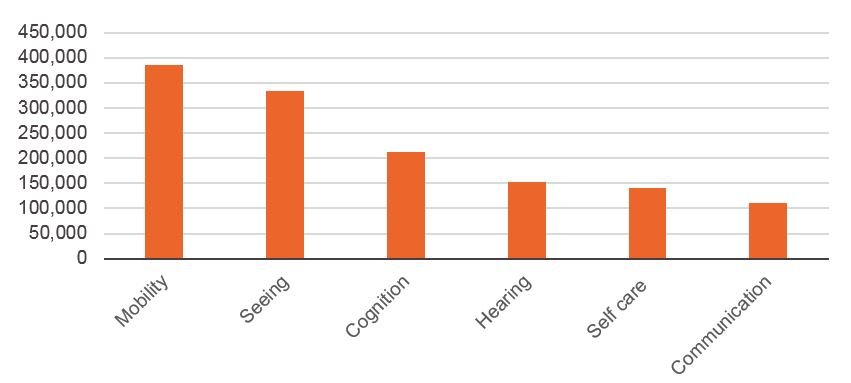
Mobility difficulties are the most commonly reported disability, experienced by 0.4 million people. This is followed by difficulties in seeing at 0.3 million people, difficulties in cognition at 0.2 million people and difficulties in hearing at 0.2 million people. Difficulties with self-care and communications are experienced by 0.1 million people each.
Source: Development Initiatives based on KNBS
National and subnational prevalence rates
Subnational analysis of the national disability rate of 2.2% reveals a divergence in disability prevalence rates across counties (Figure 4). The highest prevalence rates of disability were recorded in central, eastern and western parts of Kenya. Embu county (4.4%) has the highest prevalence rate, followed by Homa Bay (4.3%), Makueni (4.1%), Siaya (4.1%) and Kisumu counties (4%). Counties with the lowest disability prevalence rates are found in the north eastern part of Kenya and Nairobi. Wajir has the lowest, with 0.6%.
Figure 4: Distribution of adults and children above five years of age by disability prevalence rate
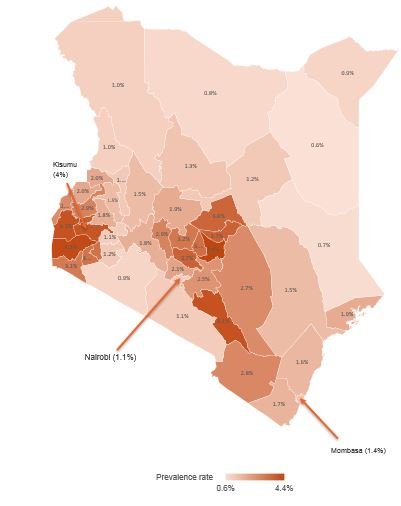
Disability prevalence rates at the subnational level varies by county. The highest prevalence rates are in central, eastern and western parts of Kenya. The highest recorded prevalence rate of 4.4 percent was in Embu county while the lowest was in Wajir, at 0.6 percent.
Source: Development Initiatives based on KNBS
Disability domains at national and subnational levels
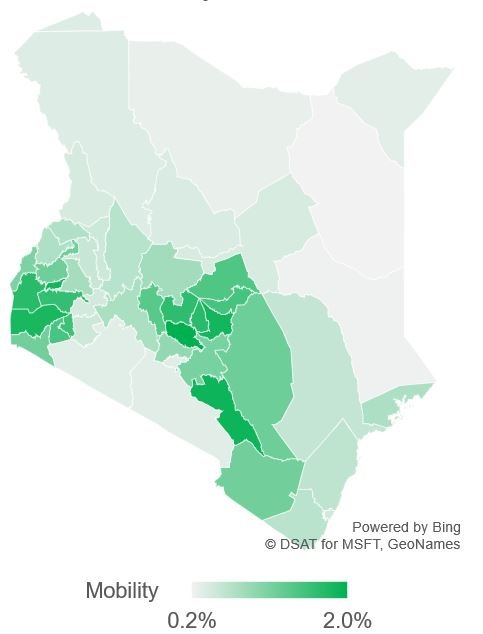
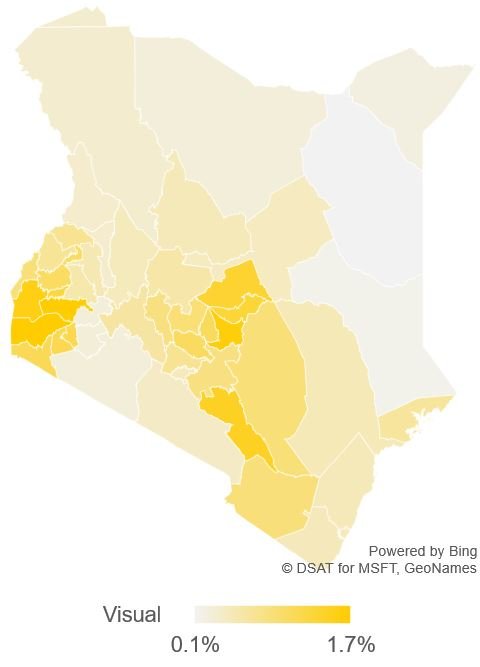
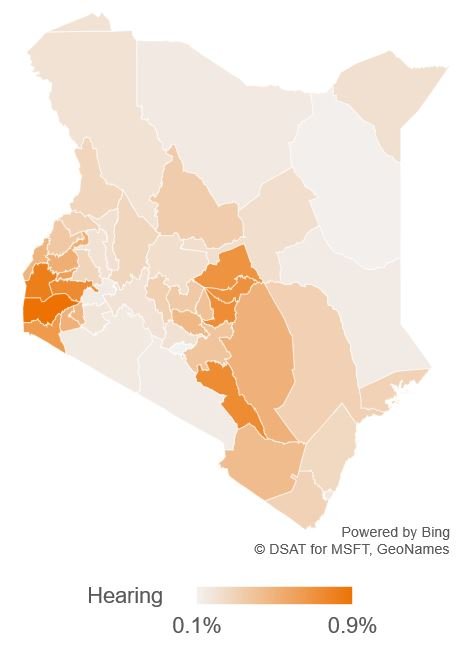
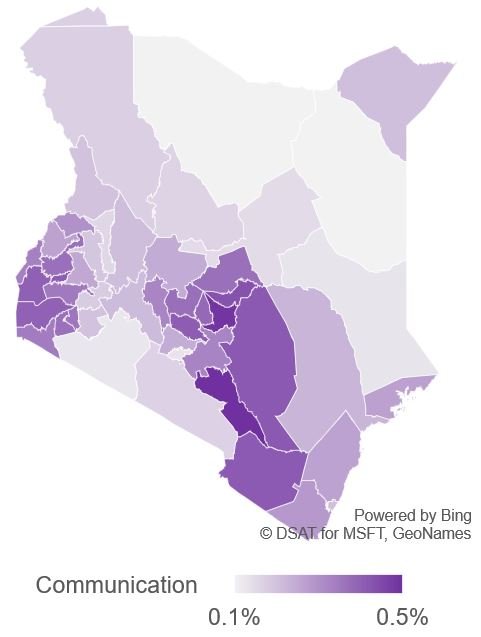
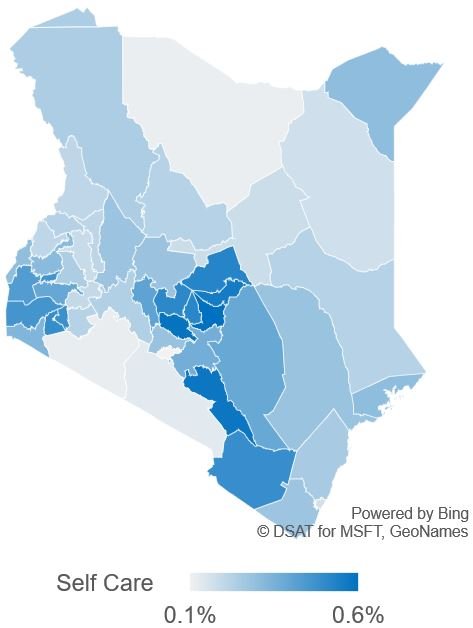
These geographical trends are mirrored when disaggregating disability domains by county. Prevalence rates of people with visual difficulties range between 1.7% and 0.1%, hearing difficulties from 0.9% to 0.1%, mobility difficulties from 2.0% to 0.2%, cognitive difficulties from 1.3% to 0.2%, self-care difficulties from 0.6% to 0.1%, and communication difficulties from 0.5% to 0.1%. Table A1 in the appendix disaggregates prevalence rates by disability domain in all 47 counties.
Figure 5c: Distribution of people with disability by domain and residence: Cognition difficulties
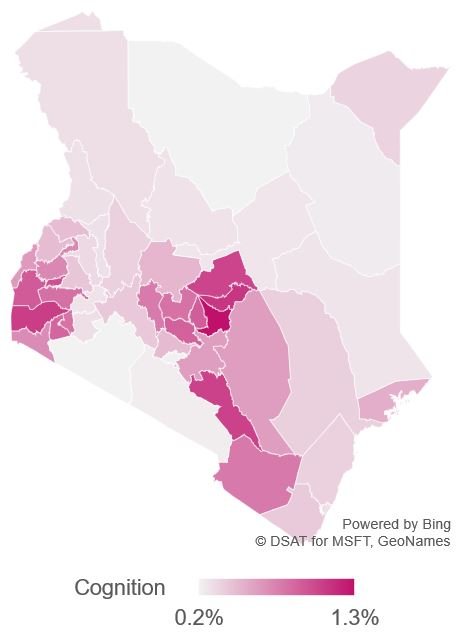
Counties in the western or eastern parts of Kenya have the highest disability prevalence rates in all domains except for mobility. Muranga has the highest prevalence rate in mobility disability at 2 percent, while Kisumu has the highest in seeing difficulties at 1.7 percent. Embu county has the highest prevalence rates in both cognition and self-care difficulties. Homa bay has the highest prevalence of hearing difficulties at 0.9 percent, while Makueni has the highest prevalence of communication difficulties, at 0.5 percent. The counties with lowest prevalence rates of all six disability domains are found in the North-eastern part of Kenya and Nairobi. Wajir has the lowest prevalence in mobility, seeing and communication difficulties while Marsabit has the lowest rates for cognition difficulties. Nairobi has the lowest rates in both self-care and hearing difficulties.
Source: Development Initiatives based on KNBS
Unpacking Kenya’s disability statistics
The World Health Organization estimates a global disability prevalence rate of 15%. The prevalence rate provided in the 2009 Kenyan census was much lower than this global figure, at 3.5%. Despite the use of UN-recommended disability questions and efforts to ensure accurate application of methodology, the 2019 prevalence rate was still low at 2.2%.
There are a number of possible reasons for the low prevalence rate in the 2019 census:
- Stigma associated with acknowledging disability might have prevented accurate reporting . The phrasing of the disability questions followed international standards, and enumerators were trained to use the correct terminology, so prejudices that could have arisen through use of stigmatised terms such as ‘disability’ or ‘impairment’ should have been avoided. Without further investigation it is not possible to identify the extent to which stigma about disability impacted the 2019 census results, and mitigating against such a widespread and embedded issue may have been unavoidable.
- The translation of disability questions into local languages may have caused inaccuracies . While conveying the contents of the census survey into Kenya’s local languages, issues of contextualisation, cultural nuances and variation of concepts may have arisen. The translated questions may have lacked the purposeful sensitive phrasing of the English version, unintentionally creating a sense of stigma around the questions that could have impacted the accuracy of survey responses.
- The inclusion of a question on albinism may have impacted the response. Although it is not a functional disability, a question on albinism was included within the section on ‘information on persons with difficulties in doing activities in daily life’ and may have impacted the findings. Albinism is a condition associated with significant stigma and superstition in Kenya, and so mentioning it alongside functional difficulties may have impaired the impartiality intended by the Washington Group Questions. The question was asked after the six questions on functional difficulty, so it may not have prejudiced the response to the same extent as it could have done if asked beforehand.
- The inclusion of ‘Don’t know’ as a response within the functional difficulty questions may have had an impact. This is not standard practice for the Washington Group Questions. It is not clear how these respondents have been treated within KNBS’ census volumes, however it is possible that the inclusion of ‘Don’t know’ as a choice could have lowered the reported disability prevalence rate. [8]
- Exclusion of children under five years of age in the 2019 census may have had some impact on the findings . It is unlikely, however, that this had a significant impact, as demonstrated when comparing 2019 rates with data on adults and children above five years of age extracted from the 2009 census. Diagnosing disability in a child is problematic as they experience continuous change in their ability to perform activities and development milestones are reached at different ages. The Washington Group Short Set of Questions are not intended for use with children. [9]
- Kenya’s population may have lower than average rates of disability. Disability prevalence increases with age, and so countries with large aging populations will have higher prevalence rates. Kenya has a young population and so could have lower disability prevalence rates than some other countries.
Implications of Kenya’s disability statistics
The inclusion of the Washington Group Questions in the 2019 census shows positive intentions towards accurate disability measurement in Kenya. The use of the Washington Group Questions has provided a framework for future censuses in Kenya, allowing comparability across timeframes and locations.
While the low reported prevalence rates raises questions about whether the figures represent the reality, there are no clear answers as to why such a high proportion of disabilities appear to be missing from the disability statistics. Deeper analysis into socioeconomic and demographic characteristics and trends (enabled by the future release of census microdata) may help shed light on this issue.
The impact of the potentially dramatic underrepresentation of people with disabilities in the official statistics is severe: if the statistics are not accurate, yet are broadly accepted, the focus on disability inclusion will not receive significant attention on Kenya’s political agenda. It may also have a damaging impact on the inclusiveness of Kenya’s response to coronavirus. Underestimating the scale of disability prevalence in Kenya will negatively impact the accurate design of policies and programmes targeted towards meeting the needs of people with disabilities. Efforts to include people with disabilities into employment, education and healthcare will fall short of meeting needs, and the level of funding allocated to these programmes will be inadequate. At a time of global economic downturn when substantial declines are also expected in aid budgets [10] , it is critical that accurate data is available to ensure the rights and dignity of people with disabilities.
To address these concerns, a discourse must be developed on what can be done to improve the accuracy of Kenya’s disability data. The leadership of people with disabilities and the organisations that represent them is critical to ensure that the challenges experienced with the 2019 census are fully recognised and accounted for, and that Kenya’s statistics on disability leave no one behind.
Appendix
Table A1. Distribution of people with a disability by domain and residence
| County | Seeing difficulties | Hearing difficulties | Mobility difficulties | Cognition difficulties | Self-care difficulties | Communication difficulties |
|---|---|---|---|---|---|---|
| Baringo | 0.5% | 0.3% | 0.7% | 0.3% | 0.3% | 0.2% |
| Bomet | 0.3% | 0.2% | 0.5% | 0.3% | 0.3% | 0.2% |
| Bungoma | 0.7% | 0.4% | 0.7% | 0.4% | 0.2% | 0.3% |
| Busia | 0.9% | 0.5% | 1.1% | 0.6% | 0.3% | 0.3% |
| Elgeyo Marakwet | 0.4% | 0.2% | 0.5% | 0.2% | 0.2% | 0.2% |
| Embu | 1.7% | 0.7% | 1.8% | 1.3% | 0.6% | 0.5% |
| Garissa | 0.2% | 0.2% | 0.3% | 0.2% | 0.3% | 0.1% |
| Homa Bay | 1.7% | 0.9% | 1.8% | 1.1% | 0.5% | 0.4% |
| Isiolo | 0.5% | 0.2% | 0.4% | 0.2% | 0.2% | 0.2% |
| Kajiado | 0.4% | 0.2% | 0.4% | 0.2% | 0.2% | 0.2% |
| Kakamega | 1.1% | 0.5% | 1.2% | 0.7% | 0.4% | 0.4% |
| Kericho | 0.3% | 0.2% | 0.5% | 0.2% | 0.2% | 0.2% |
| Kiambu | 0.8% | 0.2% | 0.9% | 0.4% | 0.3% | 0.2% |
| Kilifi | 0.5% | 0.3% | 0.6% | 0.3% | 0.3% | 0.3% |
| Kirinyaga | 1.1% | 0.4% | 1.7% | 0.9% | 0.5% | 0.4% |
| Kisii | 1.2% | 0.5% | 1.4% | 0.9% | 0.5% | 0.4% |
| Kisumu | 1.7% | 0.7% | 1.6% | 0.8% | 0.4% | 0.3% |
| Kitui | 0.9% | 0.5% | 1.2% | 0.6% | 0.4% | 0.4% |
| Kwale | 0.5% | 0.3% | 0.6% | 0.4% | 0.3% | 0.3% |
| Laikipia | 0.6% | 0.3% | 0.8% | 0.5% | 0.3% | 0.2% |
| Lamu | 0.7% | 0.3% | 0.7% | 0.5% | 0.3% | 0.3% |
| Machakos | 0.9% | 0.4% | 1.1% | 0.6% | 0.4% | 0.3% |
| Makueni | 1.5% | 0.7% | 1.9% | 1.0% | 0.6% | 0.5% |
| Mandera | 0.2% | 0.2% | 0.4% | 0.3% | 0.3% | 0.2% |
| Marsabit | 0.3% | 0.2% | 0.3% | 0.2% | 0.2% | 0.1% |
| Meru | 1.4% | 0.7% | 1.4% | 1.0% | 0.6% | 0.4% |
| Migori | 1.2% | 0.6% | 1.2% | 0.7% | 0.4% | 0.3% |
| Mombasa | 0.5% | 0.2% | 0.5% | 0.3% | 0.2% | 0.2% |
| Murang'a | 1.1% | 0.5% | 2.0% | 0.9% | 0.6% | 0.4% |
| Nairobi City | 0.5% | 0.1% | 0.4% | 0.2% | 0.1% | 0.1% |
| Nakuru | 0.7% | 0.2% | 0.8% | 0.4% | 0.3% | 0.2% |
| Nandi | 0.6% | 0.3% | 0.8% | 0.4% | 0.3% | 0.2% |
| Narok | 0.3% | 0.2% | 0.4% | 0.2% | 0.2% | 0.1% |
| Nyamira | 1.2% | 0.5% | 1.5% | 0.8% | 0.5% | 0.3% |
| Nyandarua | 0.9% | 0.3% | 1.3% | 0.8% | 0.4% | 0.3% |
| Nyeri | 1.0% | 0.4% | 1.6% | 0.8% | 0.5% | 0.4% |
| Samburu | 0.5% | 0.3% | 0.4% | 0.2% | 0.3% | 0.2% |
| Siaya | 1.6% | 0.8% | 1.7% | 0.9% | 0.5% | 0.4% |
| Taita/Taveta | 0.9% | 0.4% | 1.2% | 0.8% | 0.5% | 0.4% |
| Tana River | 0.5% | 0.3% | 0.6% | 0.3% | 0.3% | 0.2% |
| Tharaka-Nithi | 1.4% | 0.7% | 1.5% | 1.1% | 0.6% | 0.4% |
| Trans Nzoia | 0.8% | 0.3% | 0.7% | 0.4% | 0.3% | 0.3% |
| Turkana | 0.4% | 0.2% | 0.4% | 0.3% | 0.3% | 0.2% |
| Uasin Gishu | 0.6% | 0.2% | 0.6% | 0.3% | 0.2% | 0.2% |
| Vihiga | 1.3% | 0.6% | 1.8% | 1.0% | 0.5% | 0.4% |
| Wajir | 0.1% | 0.2% | 0.2% | 0.2% | 0.2% | 0.1% |
| West Pokot | 0.4% | 0.3% | 0.4% | 0.3% | 0.2% | 0.2% |
Source: Development Initiatives based on KNBS
Notes
-
1
2019 Kenya Population and Housing Censuses Volumes I–IV, released in November 2019 and February 2020, shared statistics on population by county and sub-county, administrative unit, age, sex and socioeconomic characteristic. Further census reports are due to be published between June 2020 and December 2021. They are/will be available here: https://www.knbs.or.ke/?p=5732Return to source text
-
2
Development Initiatives’ inclusion works scoping paper, 2019. Unpublished.Return to source text
-
3
World Health Organization, 2018, Disability and Health. Available here https://www.who.int/news-room/fact-sheets/detail/disability-and-health . The WHO estimates on people living with disabilities did use the Washington Group Questions. While the figures are therefore not directly comparable with Kenya’s census results, they provide the best estimate currently available for global figures. Disability prevalence rates lower than the WHO figures are commonly seen in censuses.Return to source text
-
4
From private correspondence with UDPK.Return to source text
-
5
Kenya National Bureau of Statistics. 2019 Kenya Population and Housing Census Vol. 4. Available at: https://www.knbs.or.ke/?page_id=3142# . Albinism prevalence rates are not included in the final aggregate of disability figures.Return to source text
Related content
ODA financing the climate–gender–disability interface: Key facts
Donors and African domestic budget allocators must consider the impact of climate change on women and girls with disabilities when making financing decisions
Multidimensional poverty: Measures and frameworks to leave no one behind
An overview of multidimensional approaches to poverty measurement to help practitioners and policymakers identify who is left behind in their context.
What is multidimensional poverty?
This briefing clarifies the concept of multidimensional poverty, highlighting the value of a person-centred and context-specific understanding of poverty.
