Targeting health ODA to need: Spending by country and disease
Is health ODA spent where need is greatest? Our analysis considers aid in countries facing developmental challenges, and diseases that cause the most deaths.
DownloadsIntroduction
Official development assistance (ODA) is an international resource provided largely by the Development Assistance Committee (DAC) donors and multilateral bodies. It is aimed explicitly at the economic development and welfare of developing countries. It is therefore well positioned to target places where need is greatest, and it is a key resource in the context of health.
Knowing where need is greatest and what form of investment is required (from emergency support to longer-term health systems strengthening) is key to ensuring support is well targeted.
This factsheet examines how health ODA is disbursed according to various measures of need. The analysis reviews the allocation of health ODA to country groups facing the greatest developmental challenges and with the lowest domestic resources available for health finance. The analysis also shows ODA funding towards specific diseases and how this compares to respective disease burdens.
A separate factsheet from Development Initiatives provides a general overview of aid spending on health, and examines key trends in ODA to health, using the latest data [1] to assess who the major donors are and where health ODA expenditure is disbursed at the recipient and subsector level.
Key facts: Is health ODA targeted against resource need?
ODA accounts for a fifth of health financing in LDCs
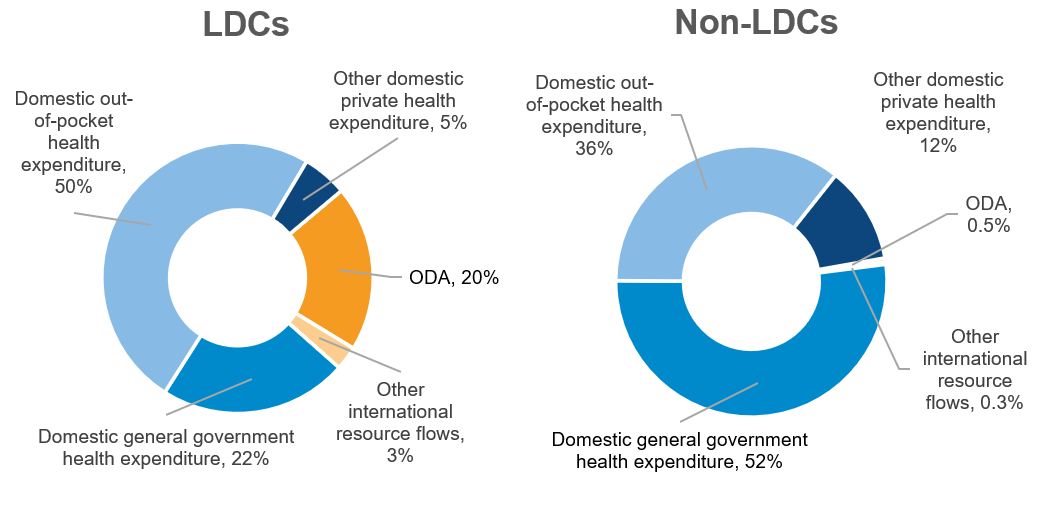
ODA makes up a fifth of available health finance in least developed countries (LDCs) (Figure 1). This group of countries experiences severe structural impediments to sustainable development and are highly vulnerable to economic and environmental shocks.
Overall, ODA to groups of countries facing significant development challenges has increased in the last five years; however a decrease in health aid between 2017 and 2018 to all of these groups is a concerning trend
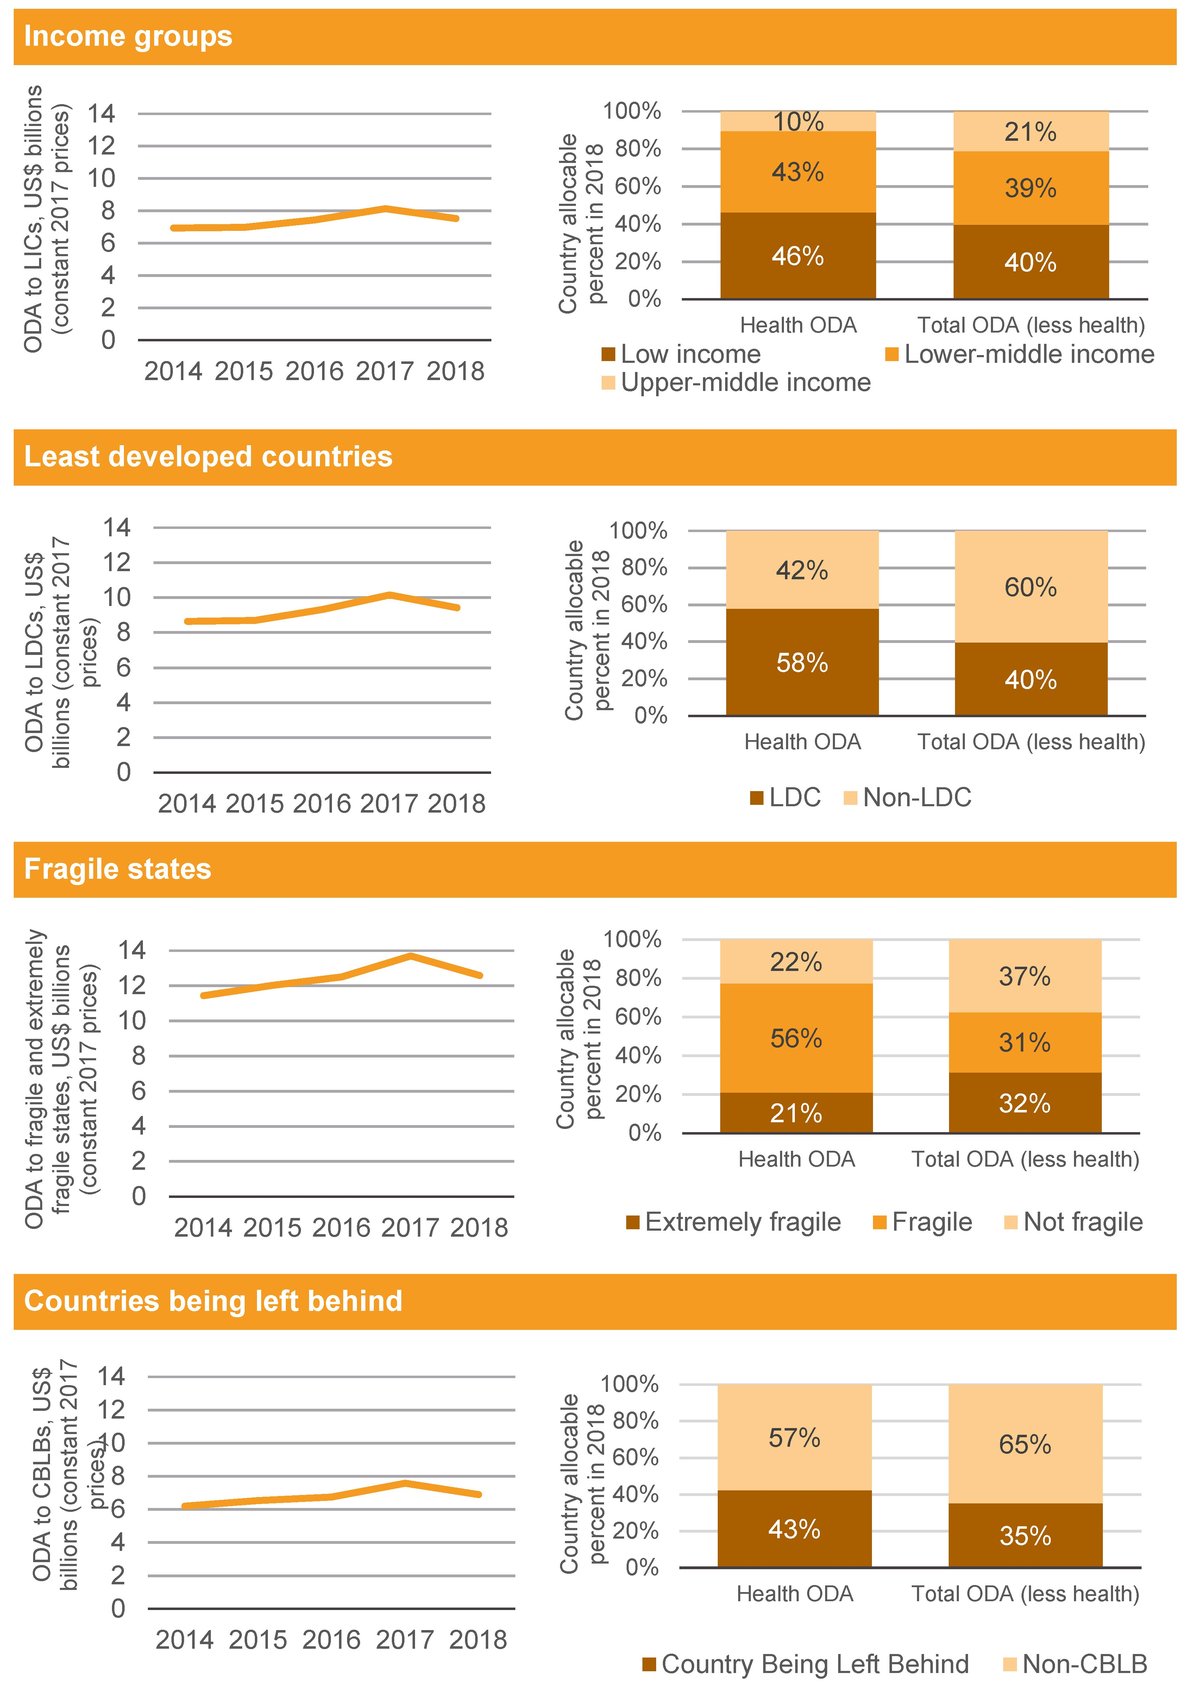
Over the last five years, ODA to health has increased by approximately 10% to various groupings of countries facing prominent development challenges. These include low-income countries, LDCs, fragile states and countries at most risk of being left behind. However, ODA to all of these country groupings fell between 2017 and 2018 (Figure 2).
Health ODA is targeted to where domestic resources are lowest
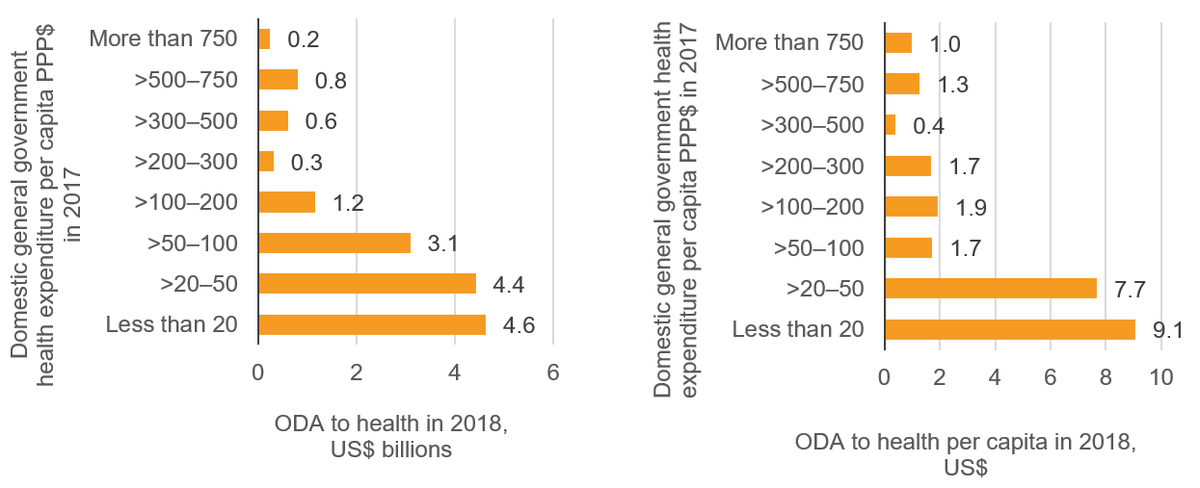
If relatively low levels of per capita government health expenditure are used as a basis of assessing need for health financing, donor funding to health is aligned relatively well to contexts facing the greatest constraints (Figure 3).
Health aid levels are notably varied among countries in most need
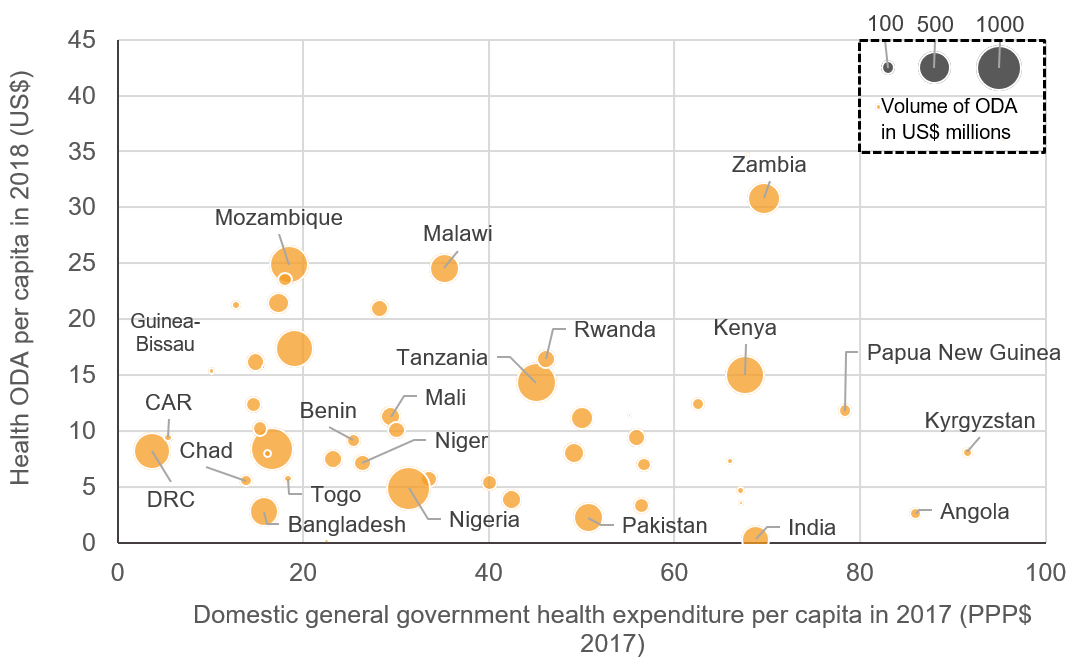
Despite the concentration of aid funding among countries most in need, there is considerable variation in the volume and per capita allocation of health ODA between countries with relatively low levels of government health expenditure (less than PPP$100 domestic government expenditure on health per capita). Some countries appear to receive relatively low levels of health ODA, in both volume and per capita terms, despite having the sparsest health finance availability.
Aid to pneumonia appears relatively low relative to its mortality burden
There are notable imbalances in funding to specific diseases according to relative disease burdens. For example, ODA to pneumonia is relatively low compared to the estimated levels of mortality caused by lower-respiratory infections (Figure 5).
How is health ODA targeted against resource need?
ODA accounts for a fifth of health financing in LDCs
- ODA makes up a fifth of available health finance in least developed countries (LDCs). This group of countries experiences severe structural impediments to sustainable development and are highly vulnerable to economic and environmental shocks. The share of ODA to total health finance in developing countries not counted as LDCs was 0.5%.
- Furthermore, half of LDC expenditure on health comes from out-of-pocket expenditure [2] (compared to just over a third for non-LDCs). Government expenditure on health in LDCs accounts for less than a quarter of the total (22%), while in non-LDCs, government expenditure accounts for over half of the total (52%).
Figure 1: Domestic and international health resource flows in LDCs and non-LDCs, 2017/2018
Domestic and international health resource flows in LDCs and non-LDCs, 2017/2018
Source: Development Initiatives, based on Organisation for Economic Cooperation and Development (OECD) Creditor Reporting System (CRS), OECD Development Assistance Committee (DAC), World Health Organization Global Health Expenditure Database and UN Office for the Coordination of Humanitarian Affairs (OCHA) Financial Tracking Service (FTS).
Notes: Data shown is for the latest year available for each flow: 2018 for ODA, private development assistance, humanitarian aid and other official flows. 2017 for blended finance and domestic public and private healthcare. Blended finance refers to blended finance mobilised by the private sector. OOFs = other official flows.
Overall, health ODA made up 1.5% of health expenditure in ODA-eligible countries. [3] Within LDCs, this share is 20%, while within non-LDCs this share is 0.5%, demonstrating that health ODA is a critical resource within LDCs.
ODA is the prominent form of international health finance in both LDCs and non-LDCs; in 2018 it made up 87% of the former and 62% of the latter. Other forms of international resource flows to health include private development assistance, blended finance mobilised by the private sector, other official flows and humanitarian assistance. [4]
Health sector humanitarian assistance [5] within LDCs stood at US$1 billion in 2018, making up 2% of total health financing in this group of countries – twice the level received by non-LDCs (US$484 million). Some other forms of international health finance were greater in non-LDCs, compared to LDCs. For example, 2018 private development assistance in LDCs was US$343 million – close to half the volume received by non-LDCs (US$663 million).
Blended finance investments are a form of finance which has seen increasing focus from donors as part of their international development strategies and within the portfolios of bilateral development finance institutions and multilateral development banks. Blended finance investments relevant to the health sector were significantly greater in non-LDCs compared to LDCs. The former saw levels reach US$1.7 billion in 2017, over 600 times greater compared to levels in LDCs (US$3 million). A number of studies have shown blended finance investments bypass the poorest and most vulnerable countries. [6]
Overall, domestic forms of health expenditure (including domestic general government expenditure, out-of-pocket expenditure and other domestic private health expenditure) [7] made up the majority of health sector finance in both LDCs and non-LDCs. In 2017/2018 they accounted for 77% of health finance in LDCs and 99% of health finance in non-LDCs. [8]
Half of LDC expenditure on health comes from out-of-pocket expenditure (compared to just over a third for non LDCs). Out-of-pocket health expenditure payments refers to direct payments for healthcare goods and services at the time of service use from the household primary income or savings. With relatively low government resources available, and the potential for economic shocks to filter down to impact the availability of resources at the household level for out-of-pocket health expenses, ODA is likely to remain a key resource for health sector financing in LDCs during and after the coronavirus response.
ODA to groups of countries facing significant development challenges has increased in the last five years
- Over the last five years, ODA to health has increased by approximately 10% [9] to various groupings of countries facing prominent development challenges. These include low-income countries, LDCs, fragile states and countries at most risk of being left behind.
- However, ODA fell to all of these country groupings between 2017 and 2018.
- Many of the same countries appear in multiple groupings. Going forward, it is critical to ensure that aid is allocated to countries facing the greatest challenges, particularly countries at most risk of being left behind.
A greater share of health ODA tends to be allocated to these country groupings compared to all other (non-health) ODA. For example, in 2018, 46% of health ODA was disbursed to low-income countries, and 10% was disbursed to upper-middle-income countries. For non-health ODA, the respective shares were 40% and 21%. While more than half of country-allocable health ODA was disbursed to LDCs (58%) in 2018 and less than half of non-health ODA (40%) is disbursed to the same country grouping.
One exception is within extremely fragile states, which received 21% of total health ODA in 2018 and 32% of non-health ODA. This difference is explained by the relatively high level of humanitarian assistance that goes to this group of counties (health humanitarian aid accounted to approximately 10% of total humanitarian aid within extremely fragile states).
Health ODA is targeted to where domestic resources are lowest
- The greatest volumes and per capita levels of health ODA are disbursed to countries allocating the lowest levels of government resources towards health.
- If relatively low levels of per capita government health expenditure are used as a basis of assessing need for health financing, donor funding to health is aligned relatively well to contexts facing the greatest constraints.
- In the context of the coronavirus crisis, ensuring this allocation pattern continues will be critical to supporting the countries most in need during their response, mitigating the impact on other health programmes and strengthening health systems which are most vulnerable.
Figure 3: Health ODA compared to government health expenditure per capita, total (left) and per capita (right)
Health ODA (left) compared to government health expenditure per capita (right)
Source: Development Initiatives, based on Organisation for Economic Cooperation and Development (OECD) Creditor Reporting System (CRS), World Health Organization Global Health Expenditure Database, World Bank World Development Indicators.
Notes: Domestic general government health expenditure excludes funding from external sources. 17 countries and ODA-eligible territories did not have data available on domestic general government health expenditure. Bands were identified in such a way as to contain similar numbers of countries within them. 15 ODA eligible countries do not have general government health expenditure data and have been excluded.
Countries with less than PPP$100 per capita in domestic general government health expenditure in 2017 received 80% of country-allocable health ODA in 2018 (out of countries with government expenditure data available).The group of 17 countries with less than PPP$20 per capita of domestic general government health in 2017 received the largest volumes of ODA in 2018 (US$4.6 billion – 30% of the country-allocable total).
ODA to health per capita shows a similar pattern of allocation to volumes, with countries at the lower end of the scale of government resource availability receiving the greatest per capita levels of health ODA in 2018. Health ODA per capita in countries with less than PPP$20 in government expenditure on health per capita stood at US$9.07, while health ODA per capita in the 13 countries with over PPP$750 per capita amounted to US$0.98.
Health aid levels are notably varied among countries in most need
- Despite the concentration of aid funding among countries most in need, there is considerable variation in the volume and per capita allocation of health ODA between countries with relatively low levels of government health expenditure (less than PPP$100 domestic government expenditure on health per capita).
Figure 4: Health ODA against government expenditure on health per capita
Health ODA against government expenditure on health per capita
Source: Development Initiatives, based on Organisation for Economic Cooperation and Development (OECD) Creditor Reporting System (CRS), World Health Organization Global Health Expenditure Database, World Bank World Development Indicators.
Notes: Domestic general government health expenditure excludes funding from external sources. The size of bubble represents the volume of ODA in 2018. ODA eligible countries which do not have general government health expenditure available are not included in the chart.
It is important to stress that all the countries within this group face significant challenges in health finance due to the relatively low levels of government resources available. Annual domestic public health expenditure per capita in this group of countries (PPP$51) is on average 73 times lower than that of high-income average (PPP$3,692).
In some countries with large populations, donor efforts do not translate into a high per capita allocation of ODA to health. For example, Nigeria was the largest recipient by volume in 2018, yet the 77th-largest recipient on a per capita basis. Bangladesh was the 11th-largest recipient by volume, yet the 89th-largest recipient on a per capita basis.
Some countries appear to receive relatively low levels of health ODA in both volume and per capita, despite having the sparsest health finance availability. Chad, Togo and the Central African Republic (all of which receive government health expenditure of below PPP$20 per capita) received per capita health ODA allocations of US$5.5, US$5.7 and US$9.4 respectively. Compared to other recipients, these countries were ranked 74th, 72nd and 49th respectively in per capita terms and 47th, 63rd, and 64th respectively in volume terms.
Out-of-pocket health expenditure can be a significant resource in contexts with limited domestic resources available for health (as shown in Figure 1, 50% of health finance in LDCs is in the form of out-of-pocket expenditure). Countries such as Nigeria and Bangladesh have high proportions of out-of-pocket health expenditure to total health expenditure (77% and 74% respectively); while in others such as Chad, Central African Republic and Democratic Republic of the Congo, out-of-pocket expenditure represents the majority of domestic finance on health (73%, 70% and 70% respectively). Settings where a significant proportion of expenditure on healthcare relies on the disposable income of a household may be more vulnerable to economic shocks, and less able to afford healthcare in the event of a shock. This, coupled with the absence of government funded healthcare in these countries, highlights ODA’s critical role during times of need.
South Sudan and Somalia are not shown in Figure 4 because there is no data available on PPP$ per capita health expenditure. Both countries are classified as extremely fragile, are LDCs and have been affected by complex emergencies which have impaired development and increased the number of people in need of health assistance. [10] [11] As a result, these countries received greater levels of humanitarian aid in 2018 (US$71 per capita for South Sudan and US$48 per capita for Somalia) compared to health ODA (US$16.2 and US$6.8 respectively) in 2018.
Humanitarian interventions in health
Humanitarian interventions in extremely fragile contexts can often be among the largest aid resource flows. For example, in 2018, 43% of ODA to extremely fragile countries was in the form of humanitarian assistance, compared to 5% for non-fragile states. While humanitarian interventions do encompass health-related activities, this form of assistance is linked to preparedness for and response to crises caused by human activity and disasters associated with natural hazards. Health development assistance may possess the capacity to perform certain longer-term interventions, such as health systems strengthening, which can fall outside the often more immediate emergency response focus of humanitarian aid.
Humanitarian assistance reported to focus specifically on health stood at US$1.5 billion in 2018. The majority of this (79%) was allocated within country contexts classified as extremely fragile. Within fragile states, health-focused ODA and humanitarian assistance combined stood at US$4.6 billion in 2018, with humanitarian assistance representing around a quarter of this total.
Certain country contexts received more humanitarian assistance reported to health than ODA reported to health. For example, in 2018 Yemen received US$581 million in health humanitarian assistance, compared to US$273 million in health ODA. Similarly, volumes of health humanitarian assistance to both Syria (US$210 million) and Iraq (US$76 million) were over triple the levels of health ODA received by those countries. [12]
Ensuring that the humanitarian–development divide is bridged by actors is a stated focus of key development stakeholders. This focus is due partly to the increase in protracted crises in recent years, which has been followed by the substantial growth in the volume of humanitarian assistance over the last decade. For example, following the recommendations of the 2016 World Humanitarian Summit, the UN’s ongoing reform process aims for UN entities engaged in humanitarian, development and peace realms to work more cohesively together. [13] This is applicable to the health sector, and key stakeholders have recommendations for bridging the divide through actions such as joint planning and learning exercises and defining collective outcomes. [14] [15] [16]
Health ODA is not always targeted towards the greatest challenges to health
- There has been a notable imbalance in funding to specific diseases according to relative disease burdens. For example, ODA to pneumonia is relatively low compared to estimated levels of mortality due to the disease.
Figure 5: ODA funding towards specific diseases compared with the respective mortality rates in ODA-eligible countries from the diseases
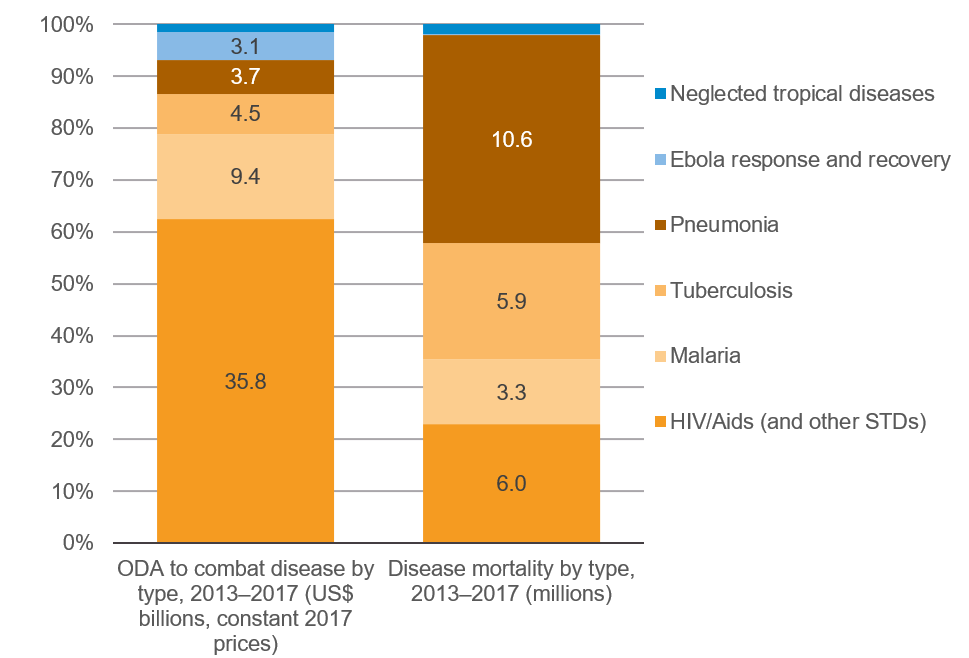
ODA funding towards specific diseases compared with the respective mortality rates in ODA-eligible countries from the diseases
Source: Development Initiatives, based on Organisation for Economic Cooperation and Development (OECD) Creditor Reporting System (CRS) and Global Burden of Disease (GBD) Collaborative Network.
Notes: Within the disease mortality by type chart, ‘pneumonia’ refers to the GBD category ‘lower respiratory infections’. [17]
To maximise the potential for ODA to reach the most vulnerable populations, it is key to focus on whether ODA allocations are made based on need in terms of country-level requirements. Similarly, for fulfilling the potential of this resource flow to achieve positive development outcomes and making sure certain areas are not left behind, it is essential to ensure that aid is targeted towards the greatest challenges to health.
Pneumonia, STDs, malaria, tuberculosis, Ebola and neglected tropical diseases globally accounted for 26.4 million deaths between 2013 and 2017. Figure 5 indicates the level of funding towards each, and highlights the visible resource gap in funding to pneumonia. Despite accounting for 10.6 million deaths between 2013 and 2017, pneumonia received an amount of funding ten-times lower [18] than the level going to STD control including HIV/Aids. [19]
Spending to neglected tropical diseases (NTDs) – a diverse group of communicable diseases that can cause significant illness – included US$835 million in ODA between 2013 and 2017 (1.5% of the total funding to the diseases shown in Figure 5). The prevalence of NTDs, however, is relatively high: they affect more than one billion people globally. NTDs often affect people among the global poorest, often in hard-to-reach areas such as remote and rural areas, or conflict zones where access to healthcare, sanitation and clean water is most limited. [20] In recent years significant progress has been made in treating those affected by NTDs and in advancing the elimination and eradication of certain NTDs; however, barriers to accessing the most marginalised are still high and will need financial resources, political commitment and innovations to overcome. [21] It is essential that adequate resources continue to be available to combat NTDs. A 2017 WHO report on neglected tropical diseases states that ‘one of the greatest challenges that will need to be faced in the coming decade will be to maintain commitments to disease-response efforts as the burden of NTDs decreases’. [22]
Downloads
Notes
-
1
Data is for the latest year available for each flow: 2018 for ODA, private development assistance, humanitarian aid and other official flows; 2017 for blended finance and domestic public and private healthcare. Blended finance refers to blended finance mobilised by the private sector.Return to source text
-
2
Out-of-pocket health expenditure payments are direct payments for healthcare goods and services at the time of service use from the household primary income or savings.Return to source text
-
3
Development Initiatives, 2020. Aid spent on health: ODA data on donors, sectors, recipients. Available at: /resources/aid-spent-health-oda-data-donors-sectors-recipientsReturn to source text
-
4
Other official flows (OOFs) are defined as official sector transactions that do not meet official development assistance (ODA) criteria. Examples of health sector OOFs can include non-concessional loans for health systems strengthening and reform.Return to source text
-
5
Within the OECD DAC, ODA in the form of humanitarian assistance is reported under the humanitarian sector, and therefore health-focused humanitarian interventions are not reported as health ODA.Return to source text
Related content
Economic poverty trends: global, regional and national
Poverty is complex and it can be described and measured in a variety of ways. In this factsheet we unpack some of the key terminology alongside the latest trends in poverty at the global, regional and national levels.
Aid spent on health: ODA data on donors, sectors, recipients
The latest data on trends in ODA to health. Who are the major donors, and where is health ODA expenditure disbursed, at recipient and subsector level?
Coronavirus and aid data: What the latest DAC data tells us
How might the coronavirus pandemic impact aid spending? DI presents analysis of preliminary ODA (aid) data for 2019. Our briefing shows how much was given and in what form.
