UK aid: Trends in the quality and quantity of UK ODA
This briefing looks at trends in UK ODA using the OECD DAC’s full data for 2020, preliminary 2021 data and near real-time aid data published to the International Aid Transparency Initiative.
DownloadsIntroduction
In this briefing, we set out recent trends in the UK’s official development assistance (ODA). As one of the largest official donors, with a strong historic reputation for focusing its ODA where it is needed most, the UK has played an important role in driving global poverty reduction efforts. However, over the last two years, political decisions around UK aid have had immediate consequences and have raised concerns about its future trajectory. With the UK due to publish a new International Development Strategy that will outline the priorities for future UK ODA, this briefing provides background by setting out trends in the quantity and quality of UK ODA using data up to 2021 from both the Organisation for Economic Co-operation and Development (OECD) Development Assistance Committee (DAC) and the International Aid Transparency Initiative (IATI). In particular, it reviews evidence around how well UK ODA has targeted the reduction of extreme poverty.
This briefing situates the trends in UK ODA in the context of current global challenges. The Covid-19 pandemic has reversed decades of progress towards achieving the Sustainable Development Goals (SDGs) and led to financing challenges in all countries. Countries face significant economic pressures, with an ongoing need for investment in recovery while continuing to address their day-to-day and long-term priorities. The situation is particularly worrying in countries where populations are experiencing extreme poverty and vulnerability, such as least developed countries (LDCs), where domestic resources are low and external finance is limited . [1] The impact of the pandemic is likely to be compounded for years to come by the global fallout of the conflict in Ukraine and the resulting unprecedented rise in global commodity and food prices.
In this context, Development Initiatives (DI) has shown that ODA is facing unparalleled pressures [2] over growing, competing and often legitimate demands, such as humanitarian response, in-country programming, investment in global public goods and climate, institutional strengthening and leveraging of other finance sources.
Global ODA volumes are not sustainably increasing to meet these demands – the 4.1% real growth in total ODA from OECD DAC donors seen in 2021, for example, was largely driven by vaccine donations. The proportion of total ODA invested in countries, (‘country-specific ODA’), has decreased over the last decade and is not sufficiently targeting the people or countries experiencing the most extreme poverty, and ODA to the countries with the highest poverty levels is growing more slowly than ODA to developing countries as a whole.
The UK, whilst remaining one of the most generous DAC donors (in terms of both volumes and ODA to GNI ratio), has seen political decisions result in shifting prioritisation and significant falls in ODA, making it an outlier relative to most other major donors. In June 2020, the UK government announced the merging of the Department for International Development (DFID) and the Foreign & Commonwealth Office (FCO), to create a new department: the Foreign, Commonwealth & Development Office (FCDO). [3] Many, including Development Initiatives, expressed concern [4] about the implications of the merger, with fears of the erosion of DFID’s strong reputation and mandated focus on poverty reduction, and the global leadership, experience and expertise that the department was reputed for. The Integrated Review of Security, Defence, Development and Foreign Policy, [5] published in March 2021, subsequently positioned UK development assistance as a foreign policy tool, to be aligned with diplomacy and defence with an increased focus on the Indo-Pacific region. Positively, it affirmed the UK’s commitment to the global fight against poverty, achieving the SDGs by 2030 and to maintaining the highest standards of evidence and transparency.
The decision on the merger was quickly followed by the first announcement of UK aid cuts, [6] £2.9 billion in 2020/2021, to keep expenditure at, but not above, 0.7% of GNI. In November 2020, the UK government decided to abandon the 0.7% GNI target due to the domestic economic impact of the pandemic, reducing to 0.5% until certain fiscal tests were met. [7] The tests are now expected to be met in 2023/24 and a decision on returning UK aid to 0.7% of GNI in 2023/24 will be made in the 2022 Autumn Budget. [8]
While the integrated review contained strategic priorities for 2021–2022 ODA, the forthcoming International Development Strategy will set the UK’s new ODA approach. At the time of this briefing’s publication, the strategy had still not been released.
As we await the new strategy and FCDO budget allocations and look to the return of UK aid to the 0.7% GNI target, this briefing provides context around trends in the quantity and quality of UK ODA. At a time of competing global priorities, it is intended to support efforts to ensure that UK ODA continues to be an effective resource for ending poverty.
Read DI's response to the UK's International Development Strategy
“This is a critical time for the world, as we deal with conflict, emerging from a pandemic and tackling the impacts of climate change. A robust approach to the UK’s development policy is needed more than ever so we can meet the demands of these challenges and continue our role as world leaders on eliminating poverty. A strong approach to development means a safer, fairer world for all.”
International Development Committee Chair, Sarah Champion MP, March 2022.
About the data in this paper
This briefing brings together data from the OECD DAC, which provides complete and verified ODA data, and therefore an important and detailed picture of what has been happening to aid. Preliminary top-level data for donor ODA has been made available for 2021 following the OECD DAC April 2022 data release. Fully disaggregated OECD DAC data is, however, published at least a year in arrears, meaning that the latest detailed aid data is available only up to 2020. This briefing uses both forms of data where it is available. The OECD DAC data for the UK shown in this paper is in £s, constant 2021 prices; where data is compared with other DAC donors, values are shown in US$.
The International Aid Transparency Initiative (IATI) is a global initiative working to improve the transparency of development and humanitarian resources that address poverty and crises. It is a voluntary standard to which many major donors publish, although timeliness, frequency and quality of reporting vary by reporting organisation. Data published by the FCDO to IATI allows near real-time insight into where and how financing is being provided to recipients up until the end of 2021. IATI cannot provide a comprehensive picture of total UK ODA, however, the FCDO publishes to a sufficient level of quality and disburses 72.3% of total UK ODA. [9] This enables critical analysis of near real-time trends, providing a vital early warning system on current UK aid spending. In this briefing, we use the term ‘aid’ to refer to ODA.
IATI and OECD DAC data for FCDO closely align but do not match exactly. Where specified, the FCDO IATI data is based on bilateral allocations only and therefore does not contain core contributions to multilateral organisations, the majority of which cannot be attributed to a sector or recipient. This allows for consistency with the approach used with the OECD DAC data for the relevant analysis. Further, current prices are used when analysing IATI data due to the focus on cuts between 2019 and 2021. In addition to looking at long term trends, this analysis includes a focus, where relevant, on changes between 2019 and 2021, when possible, to cover the trends after the merger and the decision to reduce UK ODA/GNI to 0.5%.
Key findings
Overall trends in UK ODA
The UK was the 5th largest DAC donor by volume in 2021 and 9th most generous by ODA/GNI ratio
In 2021, the UK was the 5th largest donor, behind the US, Germany, Japan and France, down from 3rd in 2020. The UK fell from 6th to 9th most generous donor by ODA/GNI measure.
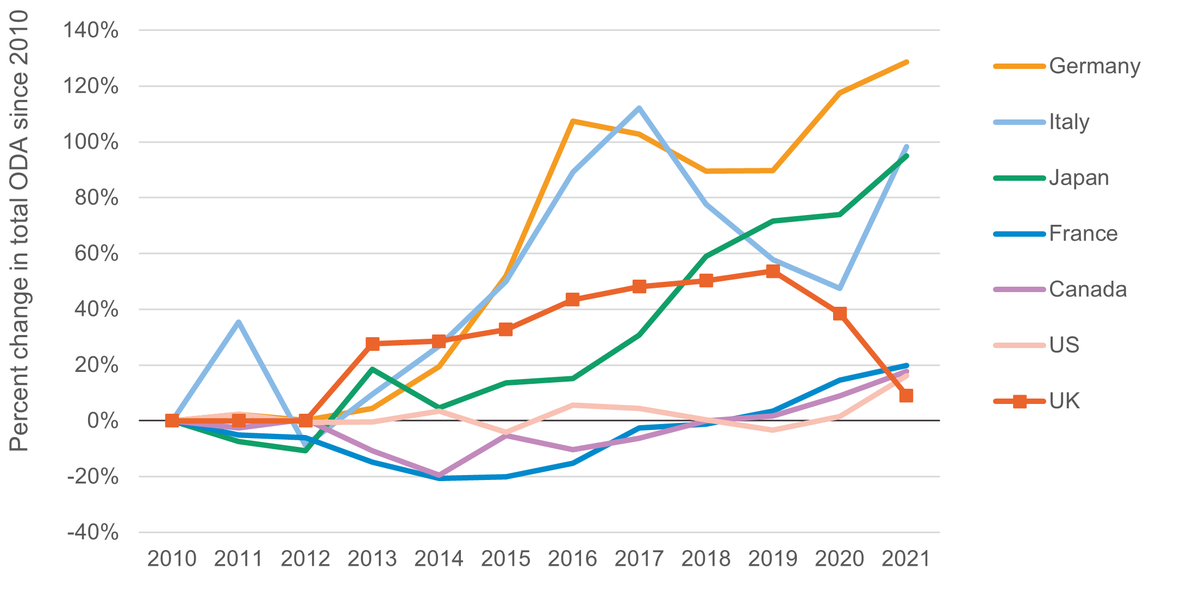
UK aid grew at the lowest rate of all G7 countries between 2010 and 2021
Aid from the UK had grown by 54% between 2010 and 2019, however, the recent decreases mean the growth rate since 2010 was set back and stood at 38% by 2020 and 9% by 2021, relative to growth between 2010–2021 of 16% in US ODA and 129% in Germany’s ODA.
UK aid fell by 28% between 2019 and 2021
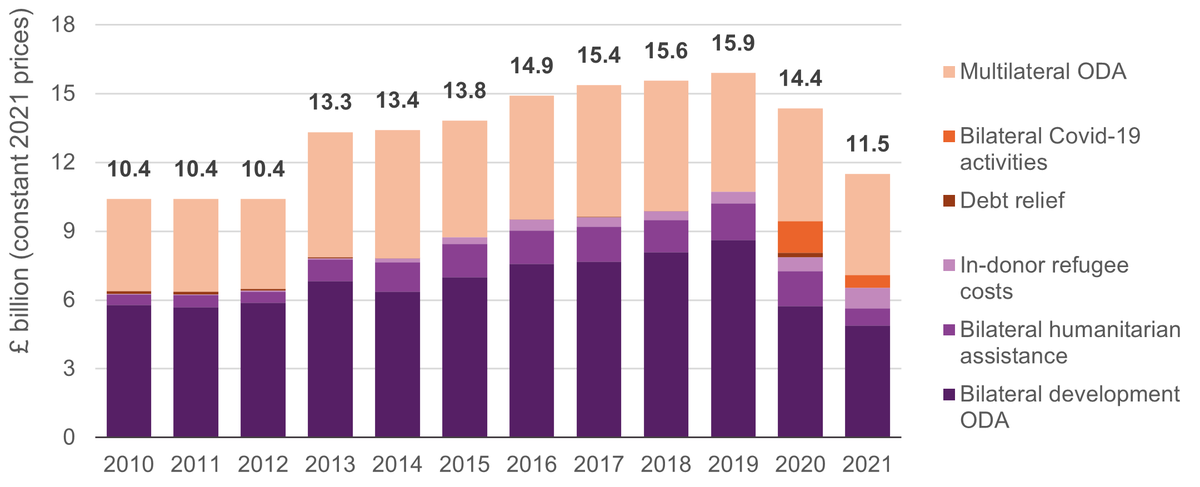
Two years of successive cuts resulted in a 28% decrease in UK ODA by 2021 from peak levels in 2019. Between 2019 and 2021, ODA fell from £15.9 billion to £11.5 billion.
In-donor refugee costs peaked in 2021, up 44% on 2020
These peaked at £898 million in 2021, up 44% on 2020 and a 60-fold increase since 2010, a trend likely to hold given the conflict in Ukraine.
By region, Africa received the greatest share of bilateral ODA from FCDO in 2021, but its lowest proportion since 2010
FCDO provided £2.6 billion in country/region-specific bilateral ODA in 2021, £2.6 billion (50%) less than in 2019. Africa’s share of bilateral ODA fell from 59% (£2.3 billion) in 2010 to 52% (£1.4 billion) in 2021.
Poverty targeting of UK ODA
Bilateral ODA has become less targeted towards people living in the greatest poverty. In 2020 more than half (56%) of the UK’s bilateral aid did not target specific countries
Between 2010 and 2020, aid not targeting specific people or places increased significantly (from 39% to 56% of the total) whilst the UK’s share of bilateral ODA going directly into countries with over 40% of their population living in extreme poverty decreased from 15% to 12% over this period.
UK ODA to LDCs has not responded to the increasing concentration of extreme poverty in these places
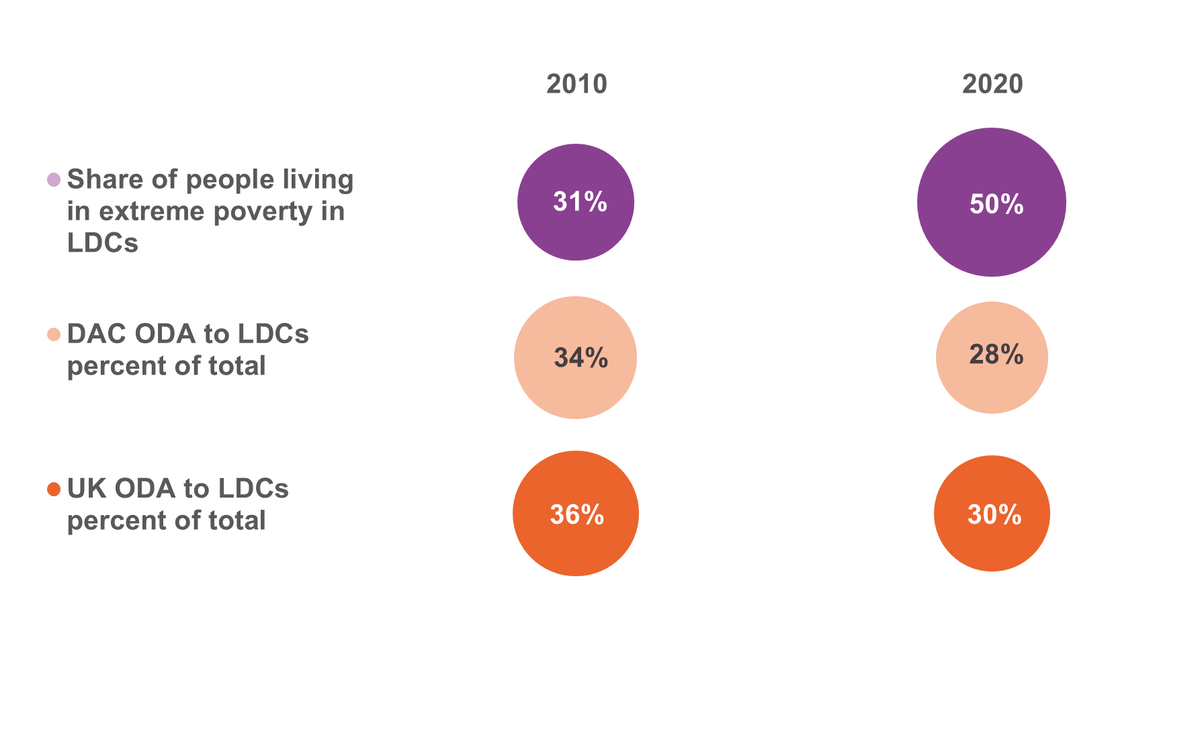
LDCs’ share of people living in extreme poverty increased from 31% to 50% between 2010 and 2020. UK ODA has not responded to this, with total UK ODA to LDCs falling from 36% to 30% over this period.
UK bilateral ODA to LDCs grew by 9% between 2010 and 2020, more than 10 times lower than the growth rate for non-country specific ODA
Bilateral aid to LDCs from the UK grew approximately 9% since 2010, greater than ODA to other developing countries (-3%) but far less than ODA that does not target specific countries (108%).
A third of UK ODA goes to sectors that directly benefit people in extreme poverty, but some sectors critical to poverty reduction in LDCs have fallen since 2010
In 2020, just over a third (around 38%) of bilateral UK ODA to LDCs was targeted to health, education, agriculture, water and sanitation, social protection and cross-cutting issues such as climate resilience and gender (slightly higher than the DAC average of 37%).
Overall trends in UK ODA
Total global ODA increased by US$7 billion (4.1%) in real terms between 2020 and 2021, to reach US$179 billion, its highest recorded level. The majority of DAC donors (23 of 29) increased their overall ODA levels between 2020 and 2021, with much of this increase resulting from the pandemic response broadly and the donation of Covid-19 vaccines specifically. The UK was a clear outlier. [10] While the UK continues to be in the top five donors by volume, the cuts in 2020 followed by the abandonment of the 0.7% ODA/GNI target in 2021 resulted in a 28% fall in UK ODA from 2019 to 2021. These cuts were not evenly distributed across ODA disbursing departments, aid types, countries or sectors. The UK departments with a development mandate – formerly DFID and now FCDO – bore the brunt of the cuts, as did bilateral ODA, LDCs and sectors most critical to poverty alleviation.
This section looks at overall trends in UK ODA in relation to other major donors and compares UK ODA before and after the merger and cuts. In addition to total ODA, we also look at FCDO spending specifically, given the greater availability of recent data. While this only accounts for 72.3% of total UK ODA, the view of more recent data is invaluable in the context of recent trends and shifting priorities.
Total ODA by DAC donor in 2020 and 2021
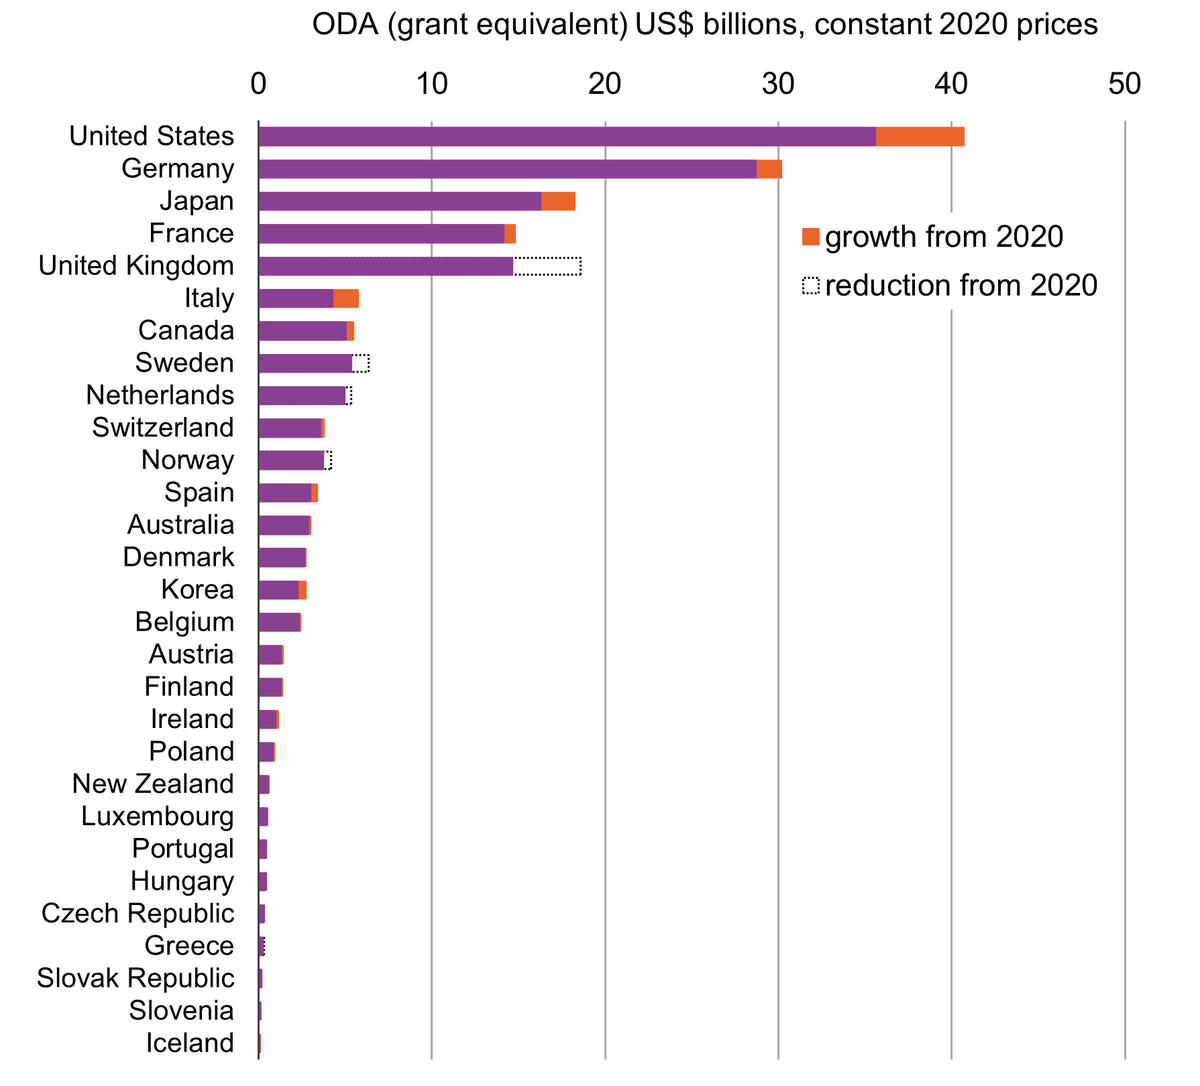
Total ODA from DAC donors reached a high of US$179 billion in 2021. Despite cuts to its ODA budget, the UK was the 5th largest DAC donor.
Figure 1: Change in total ODA between 2020 and 2021 for DAC donors
| Donor | ODA 2020 | ODA 2021 | Growth from 2020 | Reduction from 2020 | Increase from 2020 |
|---|---|---|---|---|---|
| US | 35576.3 | 40687.5 | 40687.5 | 5111.2 | |
| Germany | 28680.1 | 30143.5 | 30143.5 | 1463.4 | |
| Japan | 16260.3 | 18225.9 | 18225.9 | 1965.7 | |
| France | 14124.7 | 14774.5 | 14774.5 | 649.8 | |
| UK | 18568.2 | 14627.3 | 18568.2 | -3940.9 | |
| Italy | 4248.4 | 5714.1 | 5714.1 | 1465.7 | |
| Canada | 5051.7 | 5456.0 | 5456.0 | 404.4 | |
| Sweden | 6348.6 | 5354.9 | 6348.6 | -993.7 | |
| Netherlands | 5358.9 | 4975.4 | 5358.9 | -383.5 | |
| Switzerland | 3562.9 | 3776.2 | 3776.2 | 213.4 | |
| Norway | 4195.7 | 3707.8 | 4195.7 | -487.9 | |
| Spain | 2987.0 | 3360.6 | 3360.6 | 373.6 | |
| Australia | 2868.8 | 2996.7 | 2996.7 | 128.0 | |
| Denmark | 2651.5 | 2724.5 | 2724.5 | 72.9 | |
| Korea | 2250.0 | 2715.6 | 2715.6 | 465.6 | |
| Belgium | 2343.6 | 2397.8 | 2397.8 | 54.2 | |
| Austria | 1273.4 | 1384.6 | 1384.6 | 111.3 | |
| Finland | 1278.2 | 1347.3 | 1347.3 | 69.1 | |
| Ireland | 987.8 | 1133.5 | 1133.5 | 145.7 | |
| Poland | 829.3 | 907.5 | 907.5 | 78.2 | |
| New Zealand | 529.7 | 602.8 | 602.8 | 73.1 | |
| Luxembourg | 452.3 | 496.4 | 496.4 | 44.0 | |
| Portugal | 413.0 | 429.5 | 429.5 | 16.6 | |
| Hungary | 417.9 | 417.5 | 417.9 | -0.4 | |
| Czech Republic | 299.1 | 322.5 | 322.5 | 23.4 | |
| Greece | 325.4 | 247.7 | 325.4 | -77.7 | |
| Slovak Republic | 141.2 | 142.1 | 142.1 | 0.9 | |
| Slovenia | 90.7 | 108.0 | 108.0 | 17.3 | |
| Iceland | 57.9 | 64.7 | 64.7 | 6.8 |
Source: Organisation for Economic Co-operation and Development (OECD) Development Assistance Committee (DAC)
Notes: The chart shows grant equivalent official development assistance (ODA).
- Total ODA from DAC donors increased by US$7 billion or 4.1% in real terms between 2020 and 2021, to reach US$179 billion. Donated vaccines, rather than additional funding, accounted for US$6.3 billion of this increase. Sustained increases are therefore not anticipated. Excluding vaccine donations, ODA increased by 0.6%.
- DAC countries spent US$18.7 billion in 2021 on Covid-19-related activities, US$12.4 billion excluding vaccines, accounting for 10.5% of total ODA from these donors. The UK was the 6th largest DAC donor in terms of aid related to Covid-19 for 2021.
- Most DAC donors (23 of 29) increased their overall ODA levels between 2020 and 2021, with the greatest increases reported by the US (US$5.1 billion), Japan (US$2 billion), Germany (US$1.5 billion) and Italy (US$1.5 billion).
- The UK saw the greatest total decrease of any donor between 2020 and 2021 at US$3.9 billion (£2.9 billion). Declines in ODA from other major donors in 2021 were primarily a result of one-off increases in funding to multilaterals or exceptional Covid-19 spending in 2020, that were not reoccurring in 2021, with Sweden (US$1 billion) and Norway (US$488 million) seeing the second- and third-largest volume decreases of all DAC donors.
ODA growth for G7 donors from 2010
Since 2010, the UK showed the lowest growth in total ODA of all G7 donors countries, and in 2021 gave 0.5% of GNI.
- Between 2010 and 2019, UK ODA grew 54%. The subsequent two years of cuts, 2020 and 2021, put UK ODA only 9% above the 2010 level of US$13.4 billion (£10.4 billion).
- All other G7 countries had higher 2010–2021 ODA growth rates, with Germany (129%), Italy (98%) and Japan (95%) showing the highest growth over the period.
The 0.7% target
- Out of G7 members, only Germany met the 0.7% ODA to GNI target in 2021 (reporting 0.74%), France at 0.52% was narrowly higher than the UK (0.5%). In addition to Germany, four other DAC donors achieved an ODA/GNI level of 0.7% or higher: Luxembourg, Norway, Sweden and Denmark.
- DAC donors as a whole recorded 0.33% ODA to GNI ratios, the same as 2020.
- While remaining one of the top five DAC donors by volume, the UK’s abandonment of the 0.7% target saw it fall from being the 6th most generous donor on this measure to 9th. Luxembourg, Sweden, Norway and Denmark also reported significant falls in their ODA/GNI percentage, but all remained well above the 0.7% target.
UK aid trends
UK aid fell by 28% between 2019 and 2021.
- The UK spent 0.7% of GNI on ODA between 2013 and 2020, with growth of the UK economy resulting in steady annual growth of the ODA budget to 2019. In 2020, ODA fell by £1.5 billion (10%) due to the fall in UK GNI as a result of the Covid-19 pandemic and the government decision to maintain, but not exceed, the 0.7% target.
- The UK government’s decision to temporarily reduce its ODA/GNI ratio to 0.5% in 2021 resulted in a further 20% decrease in ODA, from £14.4 billion to £11.5 billion.
- Two years of successive declines resulted in a 28% decrease in UK ODA in 2021 from peak levels in 2019.
- Multilateral ODA from the UK made up 38% of its total ODA in 2021, where levels fell in volume terms from the previous year (from £4.9 billion in 2020 to £4.4 billion in 2021), but rose as a share of the total from 34%. [11]
- UK multilateral ODA in 2021 comprised 12% to UN agencies, 16% to the World Bank, 30% to EU institutions, 5% to regional development banks and 37% to other agencies. In 2021, funding to the World Bank fell by 23% in real terms to the lowest levels since pre-2010. Levels to UN agencies and EU institutions also fell by 1% and 5% respectively.
- Bilateral development ODA (which includes projects, programmes and technical cooperation) has remained the largest form of UK ODA. However, in 2021 bilateral ODA was at the lowest volume and proportional levels since 2010, with the share of bilateral ODA (including bilateral Covid-19-related activities) falling from 56% to 47% over this period (from £5.8 billion to £5.4 billion).
- Bilateral Covid-19 activities stood at £1.4 billion in 2020, falling to £550 million in 2021. [12] Over the two-year period, 39% of bilateral Covid-19 activities were allocated to the health sector.
- Within 2021 bilateral Covid-19 activities, £103 million of UK ODA was Covid-19 vaccine donations, of which £100 million was from excess domestic supply. [13] In 2021, 30.8 million vaccine doses were donated and counted as ODA. [14] While allowed under DAC rules, other donors such as the Netherlands and the US did not account for donations of vaccines from their domestic supply in their ODA.
- In-donor refugee costs peaked in 2021 at £898 million, up 44% on 2020 and increasing from 4.3% to 7.8% of total ODA. [15]
- Bilateral humanitarian assistance halved between 2020 and 2021, falling from £1.5 billion to £744 million (below levels in 2013).
- ODA loans from DAC donors have grown rapidly in recent years, more than doubling since 2010 to reach a peak of US$26 billion in 2020 and exacerbating concerns about a mounting global debt crisis. However, the UK is not a major provider, with less than 0.1% of the UK's bilateral ODA over the last decade being reported as loans (with zero loans in 2019 and 2020).
- While FCDO remains the largest ODA-spending department, spending £8.3 billion in 2021, the share of UK ODA disbursed by FCDO decreased from 77.7% in 2019 to 72.3% in 2021. [16]
- Of other UK ODA-spending departments, the most notable increase in ODA came from the Home Office which saw 53.3% volume growth in 2021 (to £915 million). This was driven by the growth in in-donor refugee costs, explained by increased accommodation costs for asylum seekers to ensure the government’s Covid-19 measures were adhered to.
Trends in UK bilateral aid by region
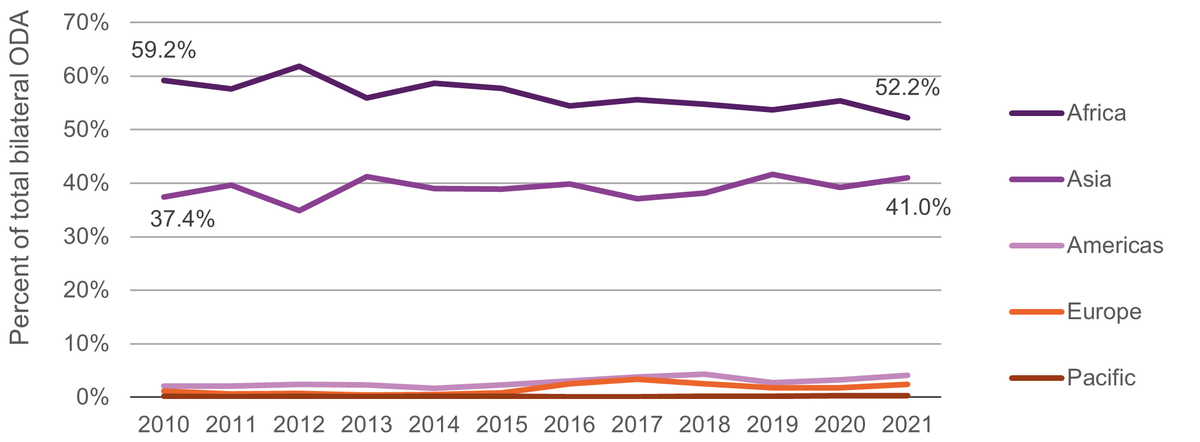
By region, Africa received the greatest share of bilateral ODA from FCDO in 2021, but its lowest proportion for a decade.
Figure 4: Share of bilateral ODA by region, 2010–2021
placeholder
Source: OECD DAC Creditor Reporting System (CRS) and Foreign, Commonwealth & Development Office (FCDO).
Notes: Chart shows ODA to the Department for International Development and the Foreign and Commonwealth Office combined for the years before 2020.
- FCDO provided £2.6 billion in country/region-specific bilateral ODA in 2021, £1.4 billion (34%) less than in 2020 and £2.6 billion down on 2019 levels. Between 2019 and 2021, this fall of 50% for country/region-specific ODA is significantly greater than the fall of 28% for total ODA.
- While Africa received the highest regional share (52.2%) this is the lowest proportion Africa has received in the last decade: it held a 59% share in 2010, which has broadly decreased since the 2012 peak of 62%. In volume terms, UK bilateral aid to Africa has fallen from £2.3 billion to £1.4 billion between 2010 and 2021.
- Since 2010, FCDO bilateral ODA to Asia fell from £1.5 billion to £1.1 billion but the share of aid to Asia has grown from 37% to 41%. The share of aid to the Americas grew from 2.1% to 4.1% and the shares to Europe and to the Pacific also increased.
- Between 2019 and 2021, FCDO bilateral ODA to Africa fell from £2.8 billion to £1.4 billion. FCDO bilateral ODA to Asia decreased from £2.2 billion to £1.1 billion in the same period.
FCDO spending published to IATI
- DI’s analysis of FCDO spending published to IATI shows that disbursements decreased for 97 of the 133 countries receiving FCDO bilateral ODA between 2019 and 2021. 75 of the 97 countries saw cuts over 20% and just over half (51) of these 97 countries experienced consecutive cuts from 2019 into 2020 and 2020 into 2021.
- Of the top 10 countries by volume of cuts to FCDO bilateral ODA from 2019–2021, six were in Asia and four were in Africa. All received cuts in excess of £100 million, except Lebanon in 10th position. All but one had average annual cuts in excess of 30% with two in excess of 40%.
- Afghanistan is the only country in the top 10 recipients to see aid cuts less than 30%. FCDO disbursements fell by 5% from £153 million in 2020 to £145 million in 2021; this is significantly below the 2019 level (£260 million).
- The highest cuts were to Ethiopia, Pakistan, Bangladesh, Yemen and Nigeria (£183 million, £175 million, £169 million, £144 million and £141 million respectively).
- Ukraine received £3.8 million from FCDO in 2021, 27% less than in 2019. So far in 2022, the UK has committed £400 million in additional ODA to Ukraine, though a significant proportion is likely to be in multilateral ODA. [17]
Changes in FCDO bilateral ODA by sector
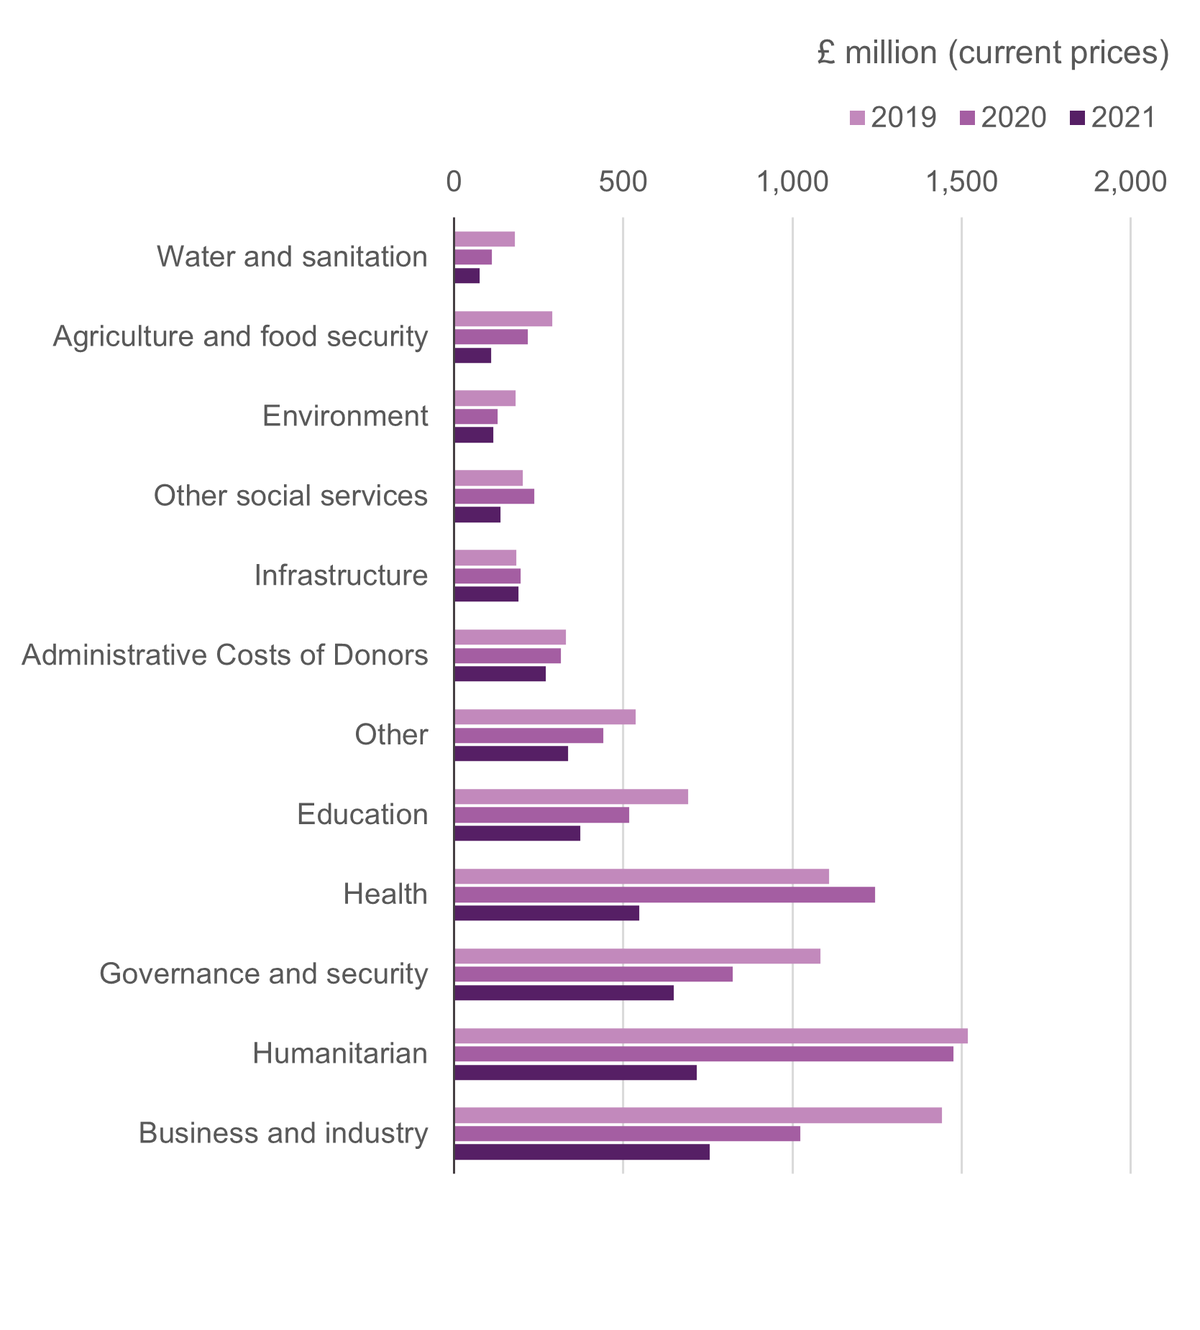
The humanitarian, business and industry, and health sectors faced the biggest volume cuts between 2019 and 2021.
Figure 5: FCDO bilateral ODA by sector, 2019–2021 (data published to IATI by FCDO)
placeholder
Source: Development Initiatives based on International Aid Transparency Initiative (IATI) data.
Notes: Sector categories are based on Development Initiatives’ aggregations using the OECD DAC sector code list, ranked by volumes from FCDO in 2021.
- In 2019, the top three sectors for the FCDO’s bilateral ODA were humanitarian, business and industry, and health (£1.5 billion, £1.4 billion and £1.1 billion respectively).
- Between 2019 and 2020, 10 of the 13 sectors saw decreases, and every sector saw decreases from 2020 into 2021.
- The humanitarian, business and industry, and health sectors saw the greatest volume of cuts between 2019 and 2021 (£802 million, £687 million and £561 million respectively). Sectors that saw the largest percentage cuts across the period were agriculture and food security (62%), water and sanitation (58%) and humanitarian (53%).
- Health was one of only three sectors to see increases between 2019 and 2020 (12%, £135 million); however, this fell by £696 million (56%) in 2021 to £548 million, 51% less than its 2019 level.
- By 2021 (following cuts from 2019 to 2021 to all sectors other than infrastructure), business and industry had become the largest sector (£756 million) followed by humanitarian (£717 million). Governance and security (£650 million) overtook health (£548 million) in becoming the third-largest sector.
Poverty targeting of UK ODA
The pandemic has underlined and strengthened the critical role of ODA in sustainably building the resilience of people living in the greatest poverty. Aid will be a fundamental part of financing the recovery in the short to medium term, particularly in places where poverty is greatest. In these places domestic resources are lower and international flows limited, while ODA plays a critical role in supporting the recovery of basic services and goods, more so than in other countries.
In this section we review the targeting of UK ODA towards reducing poverty. We initially analyse whether UK ODA is reaching the countries where extreme poverty is located. We do this through an analysis of bilateral ODA by poverty band, ODA per person living in extreme poverty (below $1.90/day) and through a review of trends in ODA to LDCs, where an increasing proportion of people living in extreme poverty are located. To further assess whether ODA is targeted towards reducing poverty within countries, we assess the amount of UK ODA going to sectors evidenced to provide the greatest benefit to the people in greatest poverty.
The data shown in this section is based on OECD DAC data. Whilst reporting to individual recipients is available up to 2020 only, this data, where applicable, allows a comprehensive picture of total UK ODA by recipient to be compared against other DAC donors and allows trends over time to be explored. Preliminary 2021 estimates on UK ODA to LDCs are available in the OECD DAC and have been used. IATI data is brought into the narrative to show recent trends not captured by OECD data.
Trends in UK bilateral aid by recipient poverty band
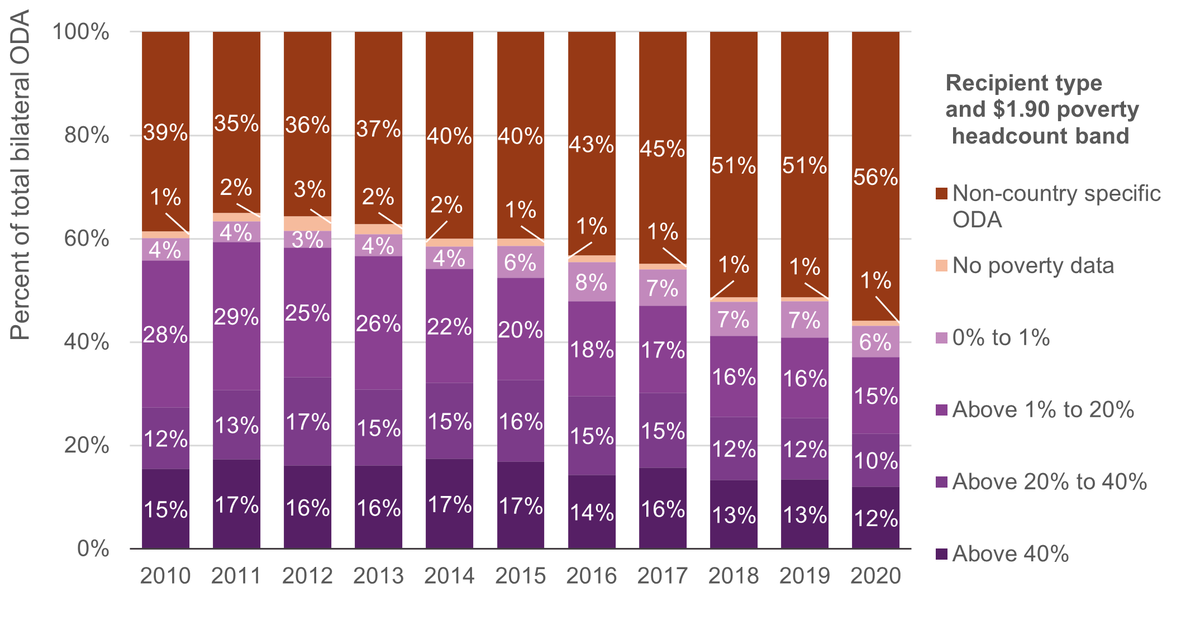
Bilateral ODA has become less targeted towards people living in the greatest poverty. In 2020 more than half (56%) of the UK’s bilateral aid did not target specific countries.
Figure 6: UK bilateral ODA by poverty band trends, 2010–2020
placeholder
Source: Development Initiatives based on OECD and World Bank PovcalNet.
Notes: Extreme poverty is defined by the $1.90 a day international poverty line (2019). PovcalNet publishes poverty data consistently up to 2017 with some partial data up to 2019. Development Initiatives forecasts data for 2019 using income distribution data (see Development Initiatives’ factsheet on poverty trends for more details [18] ). Countries for which no poverty data is available are shown in the ‘no poverty data’ category. The number of countries in each band are as follows: above 40%: 21, above 20% to 40%: 23, above 1% to 20%: 49, 0% to 1%: 33, no poverty data: 16.
- The share of UK bilateral ODA to countries with extreme poverty rates over 40% decreased from 15% in 2010 to 12% in 2020.
- The UK provided 12% of its bilateral ODA in 2020 to countries with more than 40% of the population living in extreme poverty, [19] and a further 10% to countries with between 20% and 40% of the population living in extreme poverty. [20]
- At 12%, the 2020 allocation to countries with the highest poverty rates was marginally higher than the DAC average of 11%. Of the 29 DAC country donors, the UK was ranked 12th in share of bilateral ODA targeted towards countries with more than 20% of their populations living in extreme poverty in 2019, and 9th for allocations to countries with extreme poverty rates above 40%.
- Compared with other G7 members, the UK’s share to the above 40% poverty group in 2020 was lower than the US (19%) and matched Canada, however, it was more than France (9%) and Italy (7%), double that of Germany (6%) and four times that of Japan (3%).
- The UK’s share of non-country specific ODA was 56% in 2020, among the highest of the G7 members and notably higher than the DAC average of 38%. This has risen consistently, up from 39% in 2010.
- A component of such assistance includes regional aid – bilateral ODA supporting regional initiatives and multi-country projects. The remainder (86% in 2020) does not target specific people or places, and includes a range of activities [21] such as the costs of hosting refugees, administrative costs, recapitalisation of the UK’s development finance institution CDC (now British International Investment), global programmes and global public goods (including research). While aid supporting global public goods may benefit people in poverty, it does not explicitly target nor disproportionately benefit people in extreme poverty.
UK aid per person living in extreme poverty
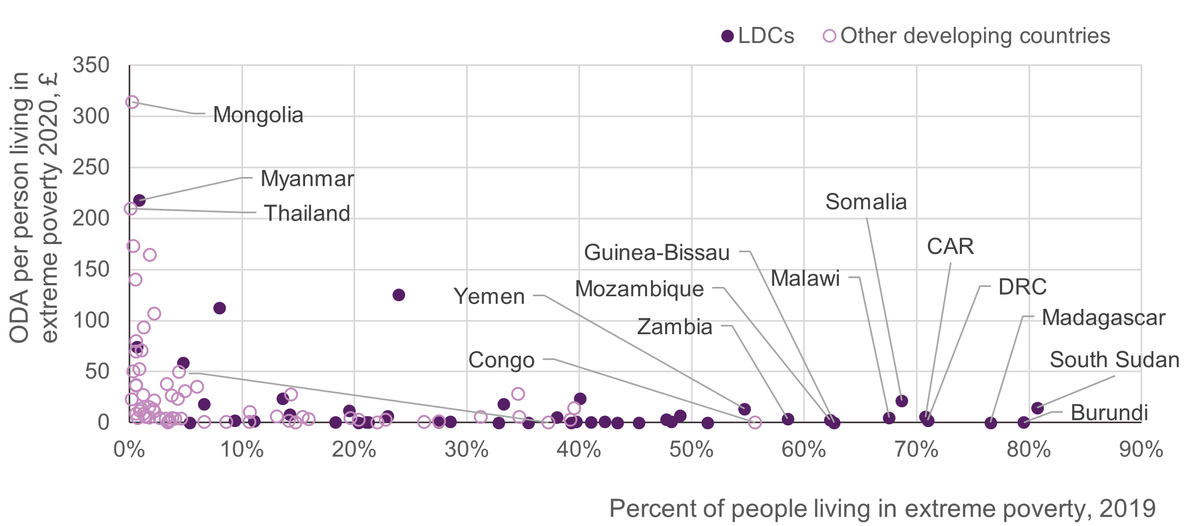
UK ODA per person living in extreme poverty is lower for countries with higher poverty rates.
Figure 7: UK ODA per person living in extreme poverty, by recipient, 2020
placeholder
Source: Development Initiatives based on OECD and World Bank PovcalNet.
Notes: Countries for which no poverty data is available have been excluded. Extreme poverty is defined by the $1.90 a day international poverty line, with poverty data taken for 2019. PovcalNet publishes poverty data consistently up to 2017 with some partial data up to 2019. CAR: Central African Republic; DRC: Democratic Republic of the Congo; LDC: least developed country.
- On a per-person-living in-extreme-poverty basis, ODA allocations are not equitable. UK ODA allocations per person living below $1.90 a day in 2020 were under £30 for every country where over 20% of the population were living in extreme poverty (44 countries). Levels were under £10 per person living in extreme poverty in 36 countries in this group and less than £1 in 19 countries (16 of which were LDCs).
- Countries with over 20% of the population living in extreme poverty combined received a median £1.20 per person living in extreme poverty per year.
- In contrast, countries with less than 20% of the population in poverty received a median ODA per person living in extreme poverty allocation of £23 and countries with less than 1% of the population in extreme poverty received a median allocation of £210.
Aid to LDCs relative to LDCs’ share of people living in extreme poverty
UK ODA to LDCs has not responded to the increasing concentration of extreme poverty in these places.
- LDCs are home to an increasing share of the world’s poorest people, rising from 31% in 2010 to half of people in extreme poverty in 2020.
- However, UK ODA allocations have not shifted to reflect this, with UK ODA to LDCs falling from 36% of total ODA in 2010 to 30% in 2020, and in 2021 preliminary estimates suggest levels will drop further to 28% of the total.
- ODA accounts for a significant share of international inflows in LDCs compared with other countries, and domestic revenues are limited. Aid therefore has a significant role to play in these countries. The share of total DAC ODA to LDCs also saw a decline between 2010 and 2020, from 34% to 28%.
Trends in total UK aid to LDCs
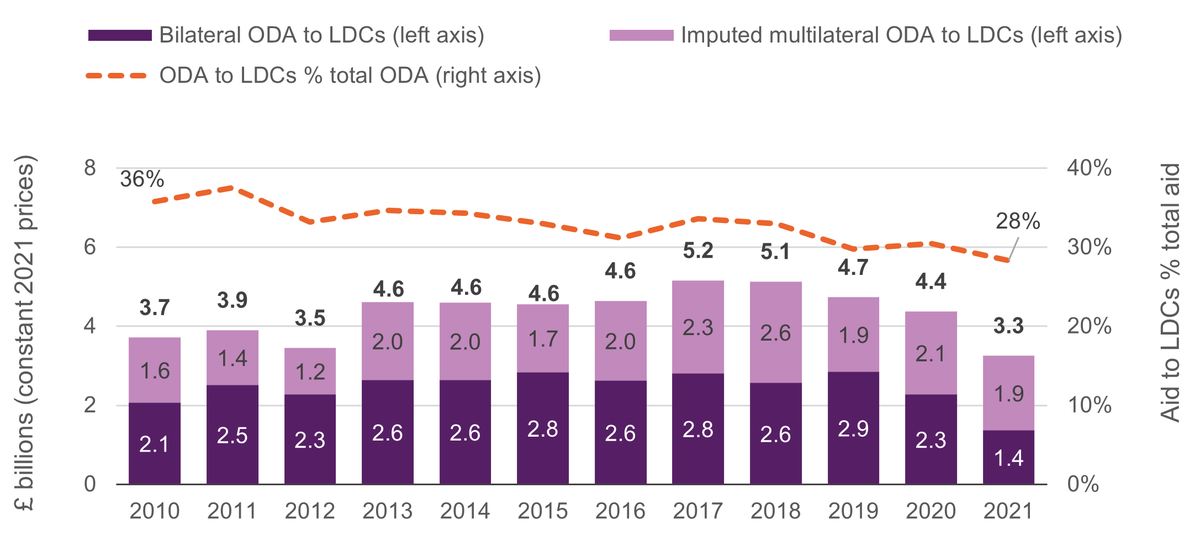
ODA to LDCs is estimated to have fallen significantly between 2019 and 2021, decreasing by 31%, more than the fall in total ODA (28%).
Figure 9: Total ODA to LDCs from the UK, 2010–2021
placeholder
Source: OECD DAC.
Notes: 2021 data is preliminary. The imputed multilateral [22] ODA value for 2021 is an estimate.
- UK ODA to LDCs is estimated to have fallen significantly between 2019 and 2021, decreasing by 31%, more than the fall in total ODA (28%).
- As a share of total ODA, ODA to LDCs dropped to 28% in 2021, down from a high of 38% a decade earlier.
- The decrease in 2021 was primarily driven by a fall in bilateral ODA to LDCs, from £2.9 billion in 2019 to £1.4 billion (a 52% decrease), and below the 2010 level of £2.1 billion. This 52% fall was almost twice the overall decrease in UK ODA in 2021, showing the disproportionate impact of the cuts on ODA to LDCs.
- In 2021, it is estimated that the UK did not reach its 2011 Istanbul Programme of Action target for OECD DAC donors to provide 0.15–0.20% of their GNI as ODA to LDCs, with UK ODA to LDCs falling to 0.14% of GNI. [23] The UK had reached this target every year over the previous decade and had exceeded it (providing over 0.2% of its ODA to LDCs) between 2013 and 2020.
Trends in aid by recipient type
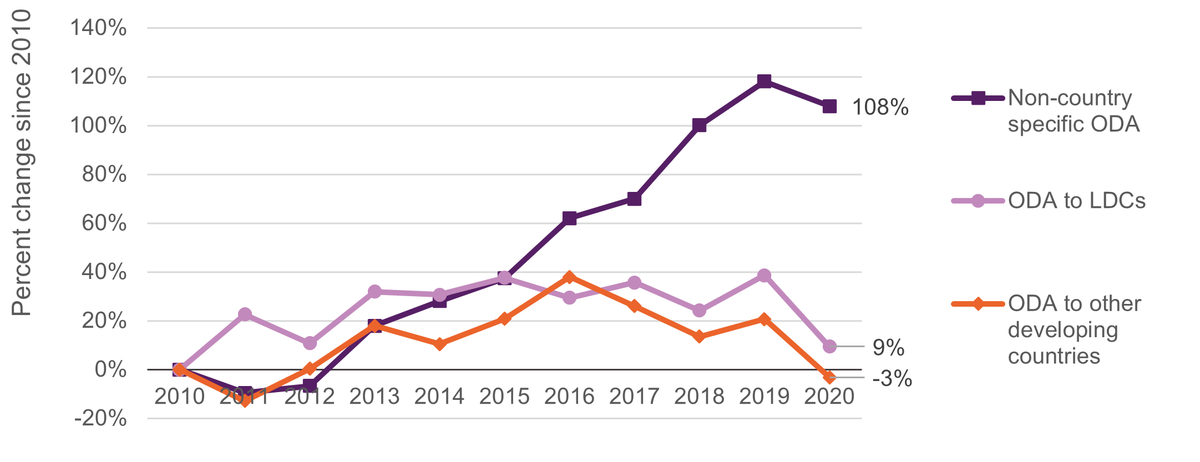
UK non-country specific ODA has grown 10 times faster than ODA to LDCs.
Figure 10: Percent change in ODA by recipient type, 2010–2020
placeholder
Source: OECD DAC.
Notes: ODA data is gross disbursements, constant 2019 prices. Non-country specific ODA refers to ODA which is allocated to several recipient countries within a specified region or across several regions or non-country programmable aid such as administrative costs, in-donor refugee costs and research costs.
- Between 2010 and 2020, UK bilateral aid flowing directly to LDCs grew at a slower rate (9%) than its overall bilateral assistance (44%).
- Bilateral aid to LDCs from the UK grew approximately 9% since 2010, greater than ODA to other developing countries (-3%) but far less than ODA that does not target specific countries (108%). [24]
- Overall country-specific ODA has grown by 3% since 2010, and year on year pre-2020 ODA growth had also been more inconsistent for LDCs and other developing countries compared with non-country specific aid, which showed a more consistent and significant rising trend.
- Non-transfer aid, which does not leave a donor country and is not allocated to a specific recipient (including donor administration costs, in-donor refugee costs and debt relief) made up just under a quarter of non-country specific ODA in 2020. ODA channelled this way grew by 285% between 2010 and 2020.
FCDO spending published to IATI
- In 2019, of the bilateral disbursements from FCDO, £1.8 billion were to non-LDCs and £2.4 billion were to LDCs. In 2020, this fell to £1.4 billion and £1.9 billion respectively, and in 2021 fell further to £0.9 billion and £1.1 billion respectively.
- This is equivalent to an average annual drop across the period from 2019 to 2021 of 32% in volume terms to LDCs and 29% to non-LDCs. In other words, a disproportionately large cut to LDC country-level projects.
Bilateral aid by sector in LDCs and non-LDCs
A third of UK ODA goes to sectors that are critical to poverty reduction, but in LDCs some of these sectors have seen falls in UK ODA since 2010.
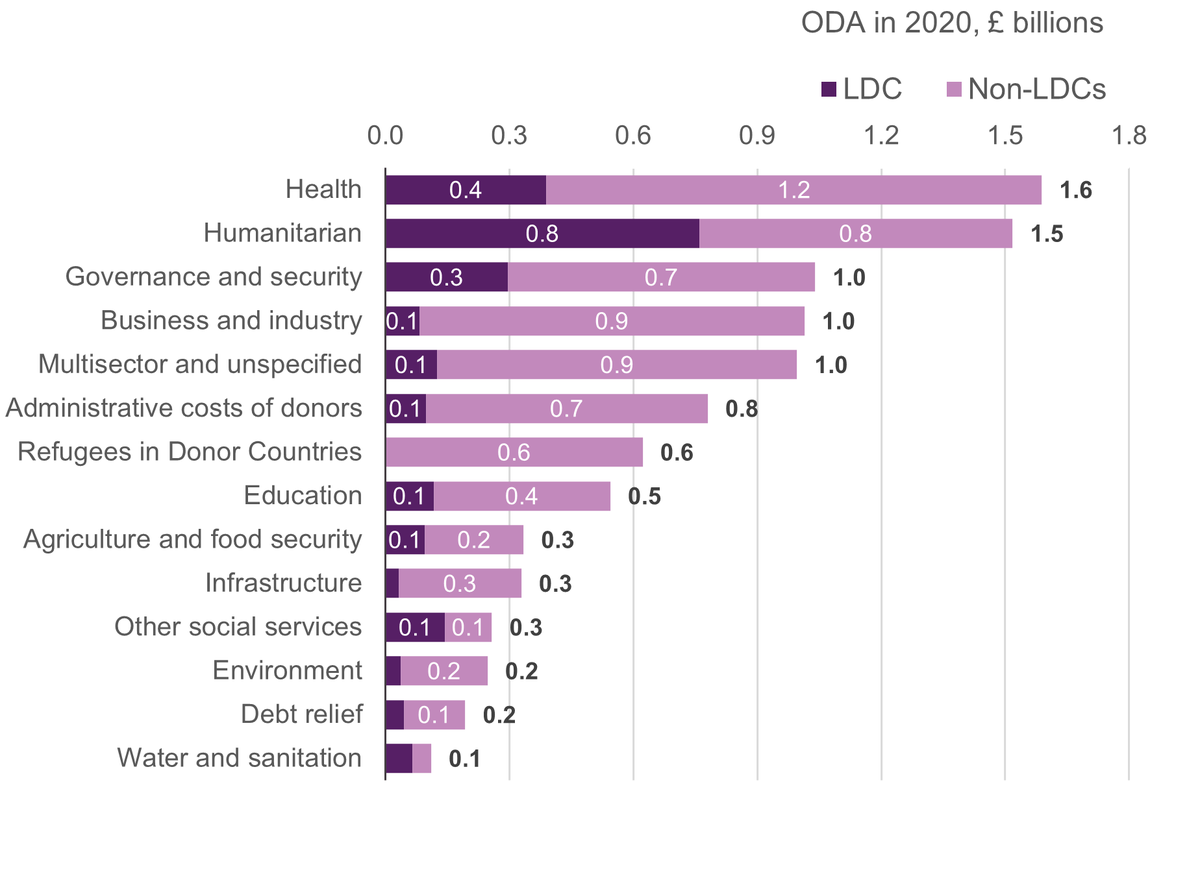
- In 2020, the top two sectors for bilateral ODA to non-LDCs were echoed in disbursements to LDCs, with LDCs receiving a quarter of total health ODA and half of total humanitarian ODA. Governance and security was the third largest sector for LDCs, with LDCs receiving 28% of total bilateral ODA to this sector.
- Over half (56%) of UK bilateral ODA to other social services, which includes activities focused on social protection, was allocated to LDCs in 2020.
- Economic and productive sectors see relatively lower shares to LDCs, such as business and industry (8%) and infrastructure (10%).
- While many types of investment and sectors can play important and supportive roles in development and poverty reduction, some sectors are particularly critical to the people living in greatest poverty in that their impact disproportionately accrues to people living in extreme poverty. These include health, education, agriculture, water and sanitation, social protection and cross-cutting issues such as climate resilience and gender.
- Aid to these sectors critical to poverty reduction in LDCs remained a relatively smaller proportion of total UK ODA to LDCs. Just over a third (around 38%) of bilateral UK ODA to LDCs was targeted to these sectors in 2020 (slightly higher than the DAC average of 37%). [25]
- In reviewing the long-term trends, while there was an absolute increase in UK aid to some of these sectors between 2010 and 2020, in particular health, some critical sectors saw a reduction in levels over this period, such as agriculture and food security (from £144 million to £94 million, a 34% decrease) and education (from £257 million to £116 million, a 55% decrease).
FCDO spending published to IATI
- Across all FCDO spending reported to IATI, disproportionately high cuts have been observed in sectors critical to poverty reduction: FCDO bilateral ODA to health falling 51%, agriculture by 62%, education by 46% and water and sanitation by 58% between 2019 and 2021. For LDCs specifically, the cuts to some sectors were even greater, with FCDO bilateral ODA to agriculture in LDCs reducing by 73% and health by 67% between 2019 and 2021.
- Other than administrative costs, the one sector seeing growth in FCDO bilateral aid to LDCs was environment. Whereas the environment sector saw cuts of 36% from 2019–2021 for total FCDO bilateral ODA, for LDCs, aid to this sector increased by 50% (from £26 million to £39 million).
Conclusion
The UK remains one of the largest ODA donors, but recent trends in UK ODA spending show a weakening of the UK’s strategic focus on global poverty reduction at a time of rising global need. Significant cuts to the aid budget including humanitarian aid, an increase in the proportion of UK ODA not resulting in transfers that go directly to developing countries and a disproportionate decrease in ODA to LDCs have resulted in less support for people living in greatest poverty. Long-term analysis and evidence using the latest available data on UK ODA is key to understanding the UK’s aid trajectory and will facilitate a more informed and rigorous analysis of the UK’s International Development Strategy and ODA budget allocations.
Acknowledgements
Our team at Development Initiatives responsible for developing this briefing from the research and analysis through to publication and comms were Verity Outram, Maria Ana Jalles D'Orey, Duncan Knox, Dean Breed, Ellie Suckling, Matt Bartlett, Emma Woodcock, Simon Murphy and Tim Molyneux.
Downloads
Notes
-
1
Development Initiatives. 2021. Reversing the trends that leave LDCs behind. Available at /resources/reversing-trends-leave-ldcs-behind/Return to source text
-
2
Development Initiatives. 2021. What are the ongoing impacts of the pandemic on development finance? Available at /resources/ongoing-impacts-pandemic-development-finance/Return to source text
-
4
Development Initiatives. 2020. Merging DFID and the FCO: Implications for UK aid. Available at: /resources/merging-dfid-and-fco-implications-uk-aid/Return to source text
-
5
Global Britain in a Competitive Age – the Integrated Review of Security, Defence, Development and Foreign Policy https://assets.publishing.service.gov.uk/government/uploads/system/uploads/attachment_data/file/975077/Global_Britain_in_a_Competitive_Age-_the_Integrated_Review_of_Security__Defence__Development_and_Foreign_Policy.pdfReturn to source text
Related content
Delivering the UK's International Development Strategy: Key considerations for UK aid
DI responds to the UK’s new International Development Strategy setting out key trends in current UK aid and shifts needed if the government is to effectively deliver on the priorities of humanitarian crisis, women and girls, and inclusive growth.
DI’s response to the UK’s new International Development Strategy
DI responds to the UK's International Development Strategy and outlines some welcome priorities alongside areas of concern.
Cuts to the UK 2020 aid budget: What IATI data tells us
This briefing compares data published by the UK's FCDO and DFID in 2019 and 2020, showing where aid budget cuts fell among recipients, countries and sectors
