Latest aid data: large increase in multilateral loans to poorest countries
DI’s Rob Tew and Tim Molyneux consider what partial data released by the OECD can tell us about recent trends in disbursements of official development assistance, and what this may mean for the future.
In January every year we are used to receiving the full picture of aid spending from the Organisation for Economic Co-operation and Development’s (OECD) Development Assistance Committee (DAC) . The DAC usually releases the full dataset of all official development assistance (ODA), setting out what all official donors disbursed a full calendar year earlier – in this case in 2020.
This year, however, we have received only partial spending data , showing a troubling lack of timely reporting by donors at a time when international cooperation is so critical. Nevertheless, we can use the data that has been released to unpack some important trends that are emerging, particularly in the area of ODA loans.
Data on multilateral ODA, including that from the major international financial institutions (IFIs), is largely complete and Japan – by far the largest provider of bilateral ODA loans – has also published its data. This means that the great majority of data on ODA loans in 2020 is available. While multilateral IFIs and Japan significantly increased ODA to developing countries, this increase was almost entirely in the form of loans, including to the poorest countries with the least ability to repay them. This raises key questions on debt sustainability.
Our interactive aid tracker is updated monthly to provide a real-time picture of what is happening to aid using data sourced from the International Aid Transparency Initiative.
Full reporting from bilateral donors has been delayed, undermining transparency and accountability
OECD DAC members have an obligation to report ODA data annually, but so far, only eight countries and the EU have reported final 2020 data (Austria, Finland, Greece, Iceland, Ireland, Japan, Norway and Sweden). To date, Japan is the only major donor and G7 member to have published complete data. Reasons for the delay have not yet been clarified.
This gap in reporting makes it impossible to provide a comprehensive assessment of how much ODA was disbursed and in what form, or a breakdown of recipient countries and sectors. This undermines efforts to achieve a full and transparent accounting of aid spending by OECD DAC members in 2020.
Of those that have reported complete data, Japan and Austria reported significant rises in bilateral ODA compared with 2019 (Japan: US$1.7 billion or 12%; Austria US$101 million or 22%). These increases were almost entirely due to increases in loans, as opposed to grants. The remaining six countries in aggregate reported virtually unchanged levels of bilateral ODA from 2019, despite the significant financing challenges that developing countries in particular are facing as a result of the Covid-19 pandemic.
ODA from multilateral donors significantly increased, almost entirely in the form of loans
By contrast, multilaterals have reported much more comprehensive data. This data shows that these donors substantially increased their ODA disbursements in 2020 compared with 2019. Once again, the overwhelming majority of this increase was due to a rise in loans. This follows a trend set over the last 10 years when, on average, multilateral donors have provided only about 40% of total ODA per year, but have provided a much larger proportion of total ODA lending: about 80%.
The partial data shows that ODA disbursements to all developing countries from all the major loan-giving multilateral donors – including the World Bank, regional development banks and the International Monetary Fund (IMF) – rose substantially, by a total of US$19.8 billion or 34% between 2019 and 2020. Again, the majority of this increase was in the form of loans, which rose by US$14.7 billion or 59%.
Loans to the poorest countries in particular increased significantly, raising debt sustainability questions
The increase in loans has been particularly pronounced in least developed countries (LDCs). Extreme poverty has become increasingly concentrated in LDCs over the last decade, and the Covid-19 pandemic has had a starker impact for people who were already facing challenging circumstances, insecurity and low incomes, pushing an estimated 76 million people into extreme poverty in 2020 .
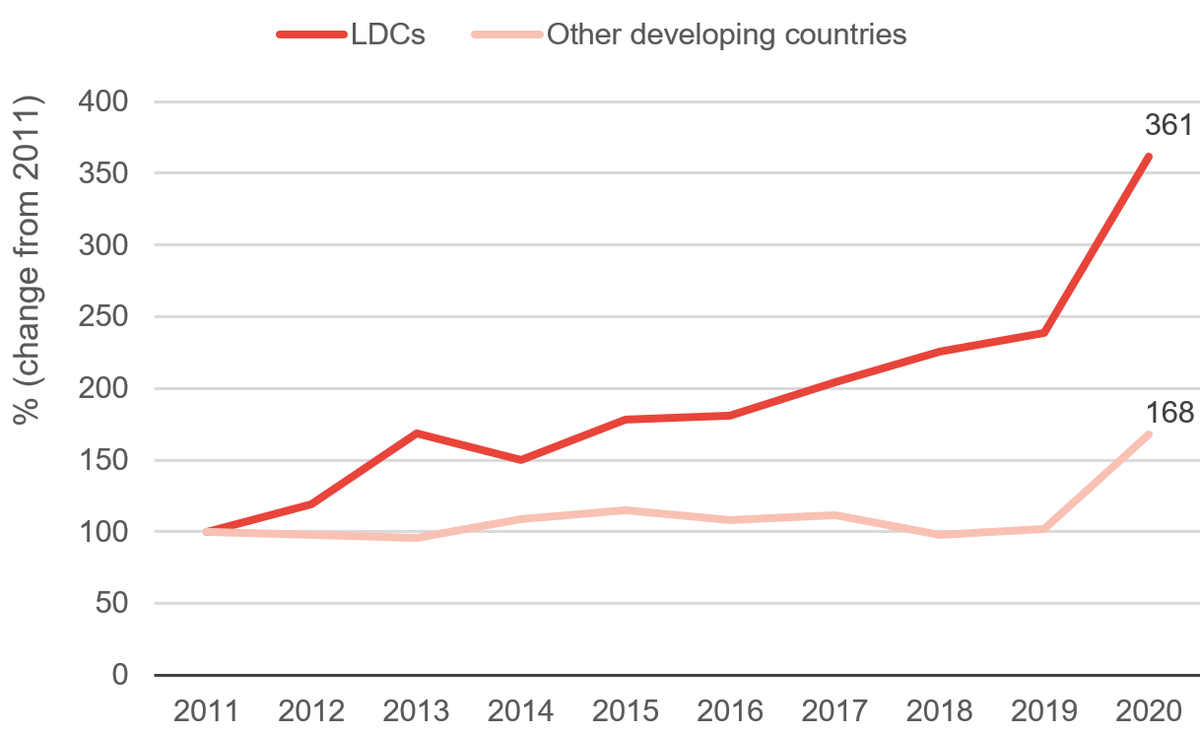
In 2019, 44% of multilateral ODA to LDCs was in the form of loans. In 2020, this figure rose to almost half, a new high of 49%. The IMF reported an especially sharp rise in its loans, which increased by US$7.8 billion or 529%. Disbursements to LDCs accounted for the majority of this increase, rising by a substantial US$5.14 billion – 1,518% – between 2019 and 2020. During the same period, Japanese loans to LDCs rose by US$1.25 billion or 62%. These rises accelerate the trend of increases in multilateral loans to LDCs. Since 2011, multilateral lending to LDCs has grown much faster than lending from these donors to non-LDC developing countries.
Figure 1: Growth in multilateral lending to LDCs and other developing countries, 2011–2020
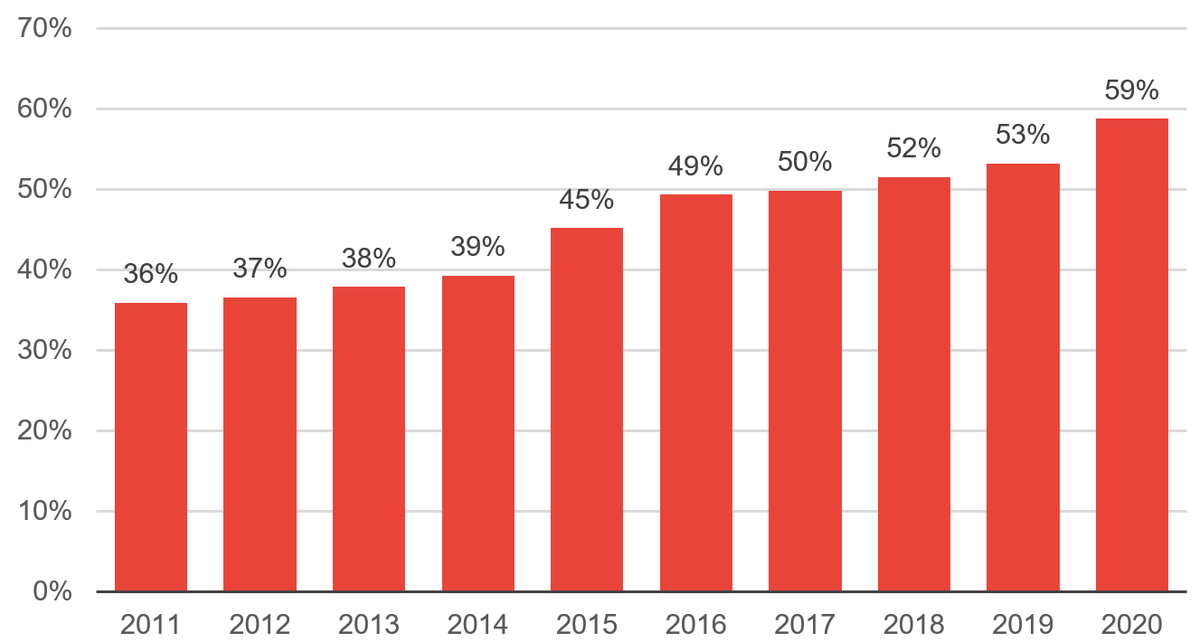
Several countries received substantial new lending despite being rated by the IMF as ‘at high risk of’, or actually in debt distress. Furthermore, the loans disbursed by the IMF had relatively short maturation periods of eight to 10 years. The increase in ODA loans to the poorest countries with the least ability to repay them has coincided with concerns over a mounting debt crisis. There is a growing debt-to-GDP ratio in LDCs overall – from 36% in 2011 to 59% in 2020 – raising questions about future debt sustainability.
Figure 2: The ratio of debt to GDP in LDCs overall, 2011–2020
While donors must publish their data with urgency, we must ask immediate questions about whether the shift towards loans is appropriate
While the Sustainable Development Goals are explicit about the need for timely, high-quality data to support their delivery, we have seen a step backwards in reporting of international aid flows as the Covid-19 pandemic has hit the world’s poorest people hardest. To aid the recovery and ensure that ODA reaches the people, countries and sectors where it can have the greatest impact, donors must make transparency and accountability through robust reporting a top priority.
In the absence of complete data, we cannot yet confirm how donors have responded to global needs or domestic pressures in terms of the volume or type of aid provided. Nor can we confirm where it is being spent and in support of what purpose, the total ODA disbursed by OECD DAC members in 2020, what proportion of that was disbursed in the form of loans or what proportion went to LDCs. However, we estimate that the initial partial data release analysed here accounts for over 40% of total ODA data, and approximately 80% of total lending data.
What is clear is that there was a significant increase in the proportion of ODA disbursed in the form of loans, particularly from multilateral donors and Japan and particularly to LDCs, which is likely to exacerbate concerns about a mounting global debt crisis.
We will publish a more comprehensive assessment of aid flows when a more comprehensive set of data is released.
Related content
Tracking aid and other international development finance in real time
This interactive data tool lets you track commitments and disbursements of aid and other global development finance between January 2018 and April 2023.
Reversing the trends that leave LDCs behind: How ODA can be targeted to the needs of people living in greatest poverty post-pandemic
This report looks at how trends leaving least developed countries behind can be reversed, and examines how official development assistance can be targeted to meet the needs of the poorest people.
ODA in 2020: What does OECD DAC preliminary data tell us?
Analysis of the OECD DAC’s preliminary 2020 ODA (aid) data. Read about trends in aid, including which donors increased or cut contributions, aid to LDCs, and changes in grants versus loans.

