Key messages
- The relevance and importance of aid is as great as ever. Official development assistance (ODA) is unique in being able to target poverty directly. But more ODA needs to be mobilised, better targeted to the poorest people and countries, and better focused on the right mechanisms, channels, sectors and modalities that build human capital and strengthen institutions.
- Aid continuing to stagnate should not be accepted. Donors can, and are, making new commitments. An additional US$1.5 trillion can be mobilised to support sustainable development if OECD DAC donors meet their 0.7% GNI pledges by 2030.
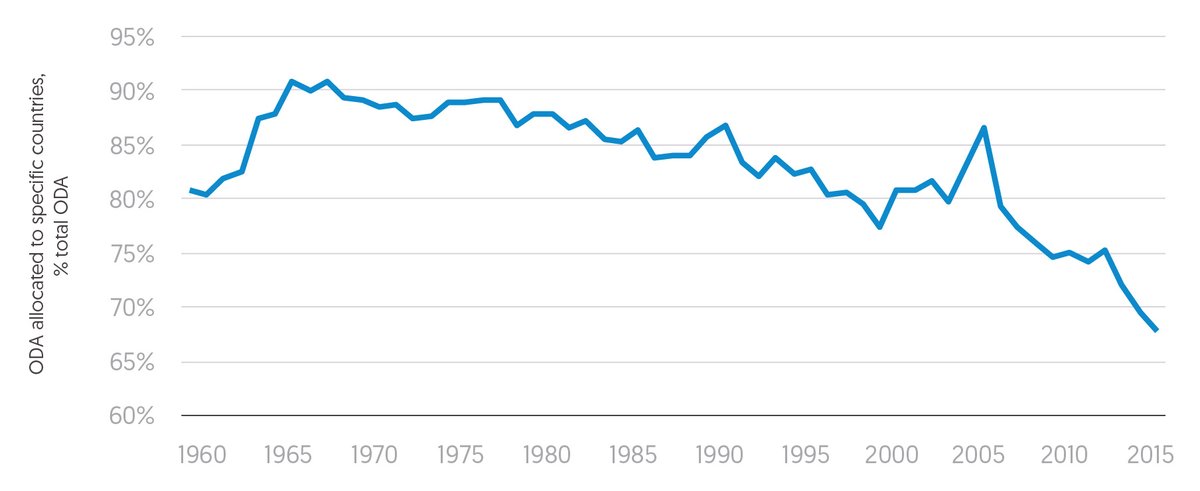
- The proportion of ODA being transferred into countries has fallen significantly such that less than two thirds of gross ODA is actually allocated to a particular country.
- The proportion and volume of ODA that is never transferred from a donor country is on the rise and stood at a peak of 18% total ODA in 2016, driven mainly by a four-fold increase in spending on refugee hosting since 2013.
- ODA is not benefiting the poorest populations nor the countries with the lowest government revenues proportionately to their needs. Just 35% of countryspecific aid (or 22% of all aid) goes to countries that account for three quarters of people known to be in extreme poverty. [1] Countries with government revenues above $4,000 per capita receive more than three times the ODA per poor person than countries with less than $400 per capita.
- ODA to the group of countries identified as being left behind has fallen by 6% since 2010, while ODA to all other recipients has risen by 32%.
- ODA focusing on specific vulnerabilities is not effectively targeting countries with the greatest needs. Climate change adaptation finance, for example, is not always going to countries known to be the most vulnerable.
- The ways in which ODA is delivered has seen a shift towards loans and away from channels that can empower countries to lead their own development agenda. Over the last decade, ODA loans have grown more than three times faster than other forms of ODA. Almost a third of loans to low income countries went to nations deemed to be in debt distress or at high risk of being so. Investments in general budget support have fallen and aid not channelled via the public sector is mainly implemented by international rather than local actors.
- ODA is not consistently targeting the sectors most critical to the poorest people. On aggregate, health and education spending is stagnating, while small volumes of aid to social protection is growing slowly and remains at just 1.4% of total aid. Nor does the distribution of sector aid always reflect the needs of the poorest people: in countries with the highest poverty levels, spending on education was US$1.2 billion lower than that given to developing countries with the lowest levels of poverty.
- Development cooperation from government providers outside the OECD DAC has seen significant increases in recent years, though to maximise its potential in the wider concessional financing landscape, improved accountability and transparency remain key.
In a rapidly changing development finance landscape, the unique value of ODA is as important as ever
Since the 1960s, ODA has been the principal resource used to stimulate development and alleviate global poverty by members of the OECD DAC. [2] It plays a unique role in the growing mix of resources available to developing countries as it is the only flow that has poverty reduction as its core purpose and therefore has a critical role to play in reaching and helping the people furthest behind. [3]
In recent years the development finance landscape has changed rapidly. While national public and commercial resources remain the primary source for development investments for many countries (see Chapter 3), total volumes of finance are increasing and the range of international finance available to many countries has expanded. ODA is a comparatively small part of this growing mix and so many donors are starting to re-evaluate what its role can and should be.
First and foremost, ODA will continue to be needed and it is important to move away from pervading pessimism about ODA stagnating with little scope to increase: this is misplaced and undermines efforts to end poverty. As Chapter 3 argues, aid cannot be automatically substituted by other types of finance and the same outcomes achieved. Crucially therefore, donors need to be more strategic about how ODA is spent. The scale and variety of non-ODA resources at the global scale creates more space for ODA to do what it does best – reach the people at greatest risk of being left behind. [4]
ODA has increased, but there is real scope to raise more
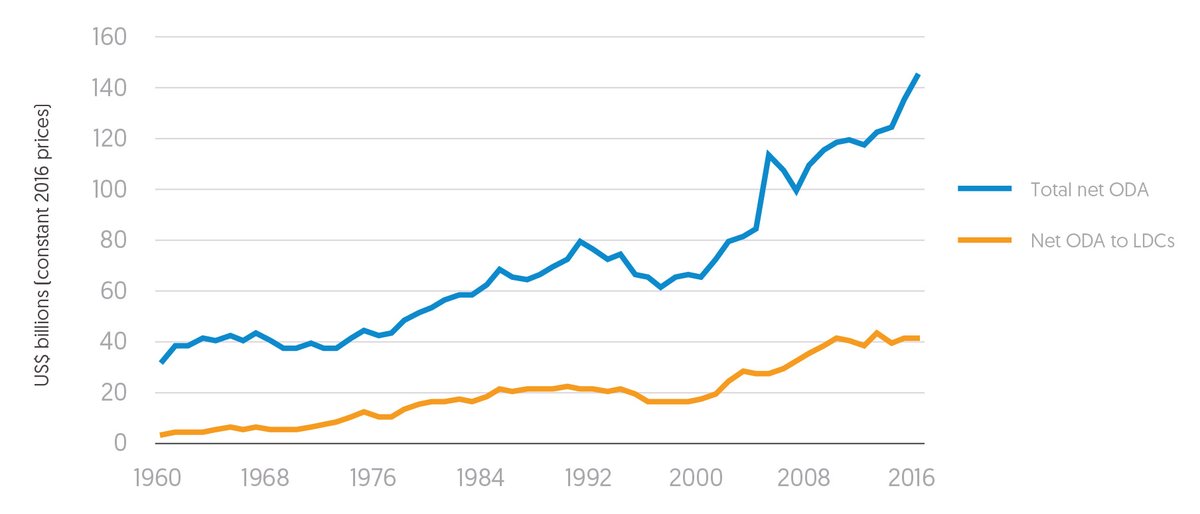
Apart from a decline during the 1990s, ODA volumes have generally followed an upward trend since 1960. In fact, in 2017, net ODA from DAC members was four times higher in real terms than in 1960. While ODA fell slightly in 2017 – the first drop in ODA levels since 2011 and 2012 when ODA fell in the aftermath of the global financial crisis – such crises come and go and should not undermine the counter-cyclical advantages of aid.
However, while ODA quadrupled, the GNI of DAC members rose more than six-fold in real terms between 1960 and 2017. This means ODA has not increased as quickly as growth and the share of DAC donors’ national income spent on ODA has fallen from just over 0.5% in 1960 to just over 0.3% in 2017.
Figure 2.1 Net ODA has grown in $ terms since the 1960s but not as a share of donors' GNI
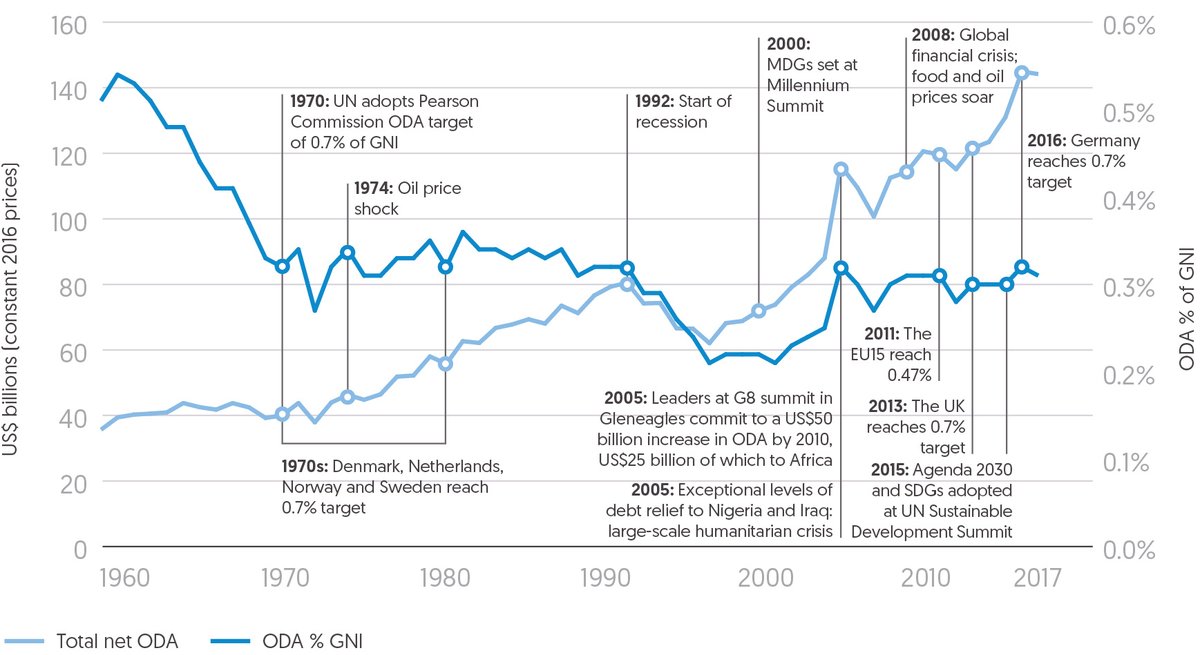
Net ODA has grown in $ terms since the 1960s but not as a share of donors' GNI
Source: Development Initiatives based on OECD DAC.
Notes: Agenda 2030: 2030 Agenda for Sustainable Development; MDGs: Millennium Development Goals; SDGs: Sustainable Development Goals
Major donors are taking steps to address this and setting new, specific and time-bound commitments to increase proportions of national income spent on aid. [5] France has committed to spending 0.55% of GNI on ODA by 2022 and reaffirmed its goal of reaching 0.7% by 2030. [6] These commitments are in line with the 1969 Pearson Commission [7] proposed target of 0.7% of donor GNI to be reached “by 1975 and in no case later than 1980” – a target taken up in a UN resolution on 24 October 1970. OECD DAC members have generally accepted the 0.7% target for ODA, at least as a long-term objective, except for Switzerland (which only became a member of the UN in 2002) and the US (although the US did state that it supported the general aims of the UN resolution).
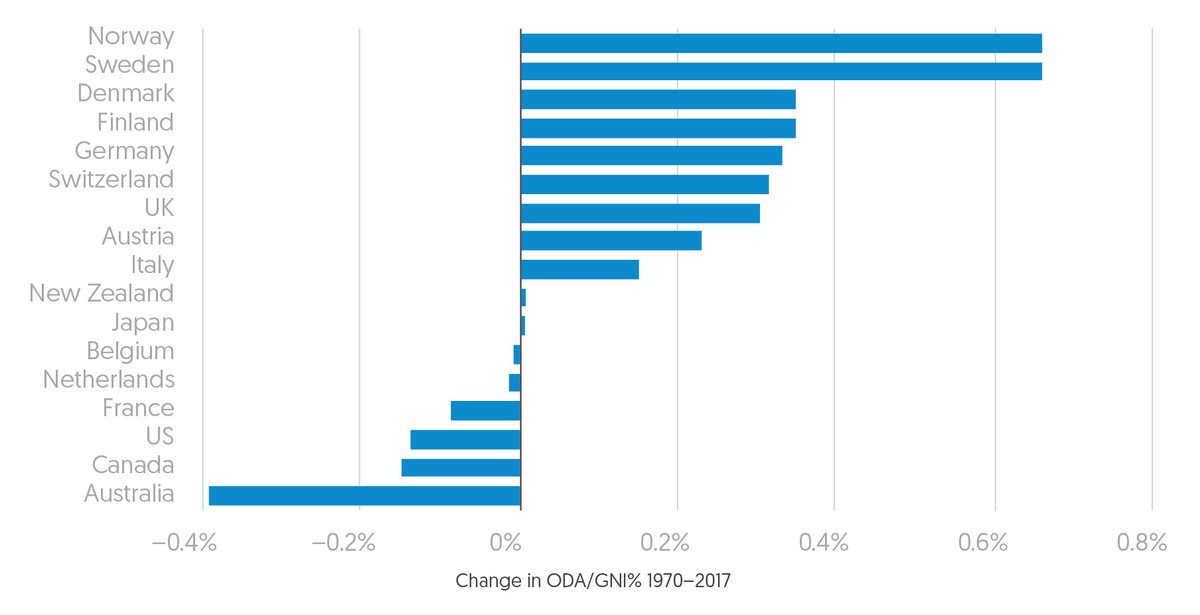
Despite this near-unanimous support from donors 47 years after the adoption of the UN resolution, just five DAC members disbursed at least 0.7% of GNI as ODA in 2017. Eighteen DAC members had ODA levels that were 0.3% of GNI or less and ten of these gave less than 0.2%. Australia, Canada, the US and France have seen the most significant falls in ODA as a percentage of their GNI since 1970.
While on aggregate the GNI/ODA proportions of the original DAC members were the same in 2017 as in 1970, newer members of the DAC give much lower proportions and this accounts for the marginal fall overall (0.31% in 2017 compared with 0.33% in 1970). These newer donors joining the global development effort are typically newly industrialised countries without a long tradition of involvement in international development. Recently joined DAC members from Central and Eastern Europe typically have small bilateral aid programmes and a significant proportion of their ODA comes from their contributions to the EU. The average amount of ODA as a percentage of GNI for donors who joined the DAC after 1970 is just 0.19% in 2017.
Low ODA to GNI ratios have significant implications: if all DAC donors had dispersed 0.7% GNI then net ODA would have been US$318 billion in 2017 – twice the current figure of US$144 billion. [8] Crucially, if all DAC members increased their ODA/GNI percentage year on year (so by 2030 they reach 0.7% GNI), US$1.5 trillion additional ODA would be disbursed between 2018 and 2030 compared with ODA/GNI percentages remaining at current levels. The impact that could be had if all donors followed those already reaching or pledging their commitment to 0.7% GNI by 2030 should put real impetus on other donors to do the same.
Figure 2.3 An additional US$1.5 trillion of ODA could be disbursed by 2030 if all donors achieved 0.7% by 2030
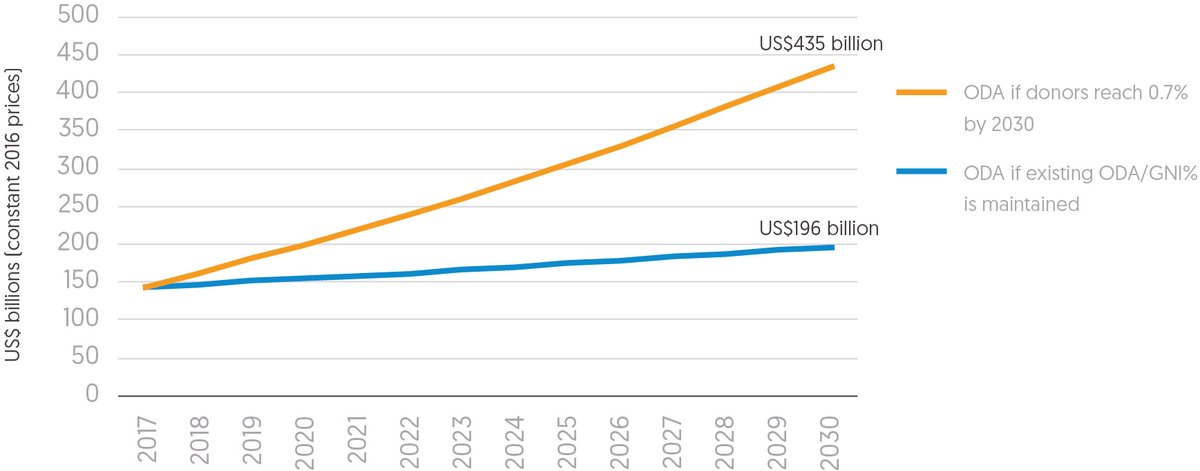
An additional US$1.5 trillion of ODA could be disbursed by 2030 if all donors achieved 0.7% by 2030
Source: Development Initiatives based on OECD DAC.
Note: Projections of GNI are based on applying the average annual growth rate of GNI over 2012–2017 to each successive year from 2017 up to 2030.
Box 2.1
How the reporting of ODA is changing
The apparent levels of ODA, in part, depend on the rules that govern which spending is eligible to be counted as ODA. As part of the OECD’s ‘ODA modernisation’ process, these rules will change in 2018. This will mean potentially significant changes in the reported volume of ODA will occur, without any change in donor spending. This will also have implications for how donors perform against the 0.7% target. [9] The main changes, in brief, are described here.
Loans
At present, the full value of any new loan is counted as ODA, but capital repayments by the borrower to the donor are subtracted from ODA to give a 'net ODA' figure. In future only a percentage of the loan, known as the 'grant element', [10] will count as ODA, and loan repayments will no longer be subtracted from the headline ODA figure. This will affect different donors in different ways – Japan, a significant provider of loans, will see its reported ODA rise as a result of these changes due to both the highly concessional nature of the loans they provide and the high volume of repayments that will no longer be discounted. Other donors, such as France and Germany, which give less concessional loans and which receive lower levels of repayments, may see their reported ODA reduce. [11]
Peace and security
Some additional activities in this area will now be eligible to be classed as ODA. [12] These are mainly non-coercive with a sustainable development objective such as support for costs where military personnel are delivering development services or humanitarian aid, or educational activities in an ODA-eligible country to prevent violent extremism. [13] Also, the percentage of core support for UN peacekeeping that can be counted as ODA will rise from 7% to 15%. [14]
Private sector instruments
Private sector instruments such as equity investments and guarantees are used by development finance institutions or investments funds set up by donors to engage in ‘catalytic activities’ that facilitate private sector growth. The existing rules do not allow for reporting of some activities that arguably have a development impact – such as loans to private sector entities that were less concessional than sovereign loans but still supported private sector development – and may have disincentivised investments in this area. In future more of these activities will be counted as ODA, but the exact rules have yet to be agreed, so the impact on ODA levels is not yet clear.
Reverse graduation and aid to high income countries in crisis
Once countries have ‘graduated’ from the list of ODA-eligible nations, there is no mechanism for them to be readmitted if their economic situations worsen. There are likely to be changes to the DAC rules to allow countries to be added to this list in such circumstances – so-called ‘reverse graduation’. This would mean that any assistance being provided by donors to these countries would be counted as ODA. There is also debate around whether assistance to high income countries that suffer severe shocks (such as the hurricane damage to some Caribbean island states in 2017) should be allowed to count as ODA, and currently no agreement among DAC members on this issue has been achieved.
The share of ODA going directly to countries is falling, and rising volumes are not being transferred from donor countries
ODA accounts for a wide range of activities, expenditures and investments and not all aid actually goes to developing countries – whether it never leaves the donor country (a non-transfer, such as, for example, debt relief, costs for hosting students from developing countries, building development awareness, some administrative costs and in-donor refugee costs), or is not allocated to specific countries (a transfer, but not to countries, for example investments in research, global initiatives, and regional aid).
The share of ODA allocated to countries has fallen rapidly in recent years and in 2016 US$54 billion, nearly a third (32%) of gross ODA was not reported as going to a specific country. A further US$6 billion was reported as being allocated to specific countries but was in a form that resulted in no transfer of resources to those countries (e.g. debt relief). Large proportions of ODA not directly allocated to countries is a relatively new phenomenon, and before 2007 this form of ODA rarely accounted for more than 20% of the total.
When coupled with a significant volume of ODA being spent in donor countries (non-transferred aid), a worrying trend can be seen. ODA going directly to countries is falling as a proportion of total ODA – with non-transfer and non-country allocated aid compounding one another. In-donor refugee costs are the largest factor causing this – up from just over 1% of total ODA in 2006 to almost 10% in 2016.
Figure 2.5 ODA spent within donor countries and not allocated to specific developing countries has risen rapidly
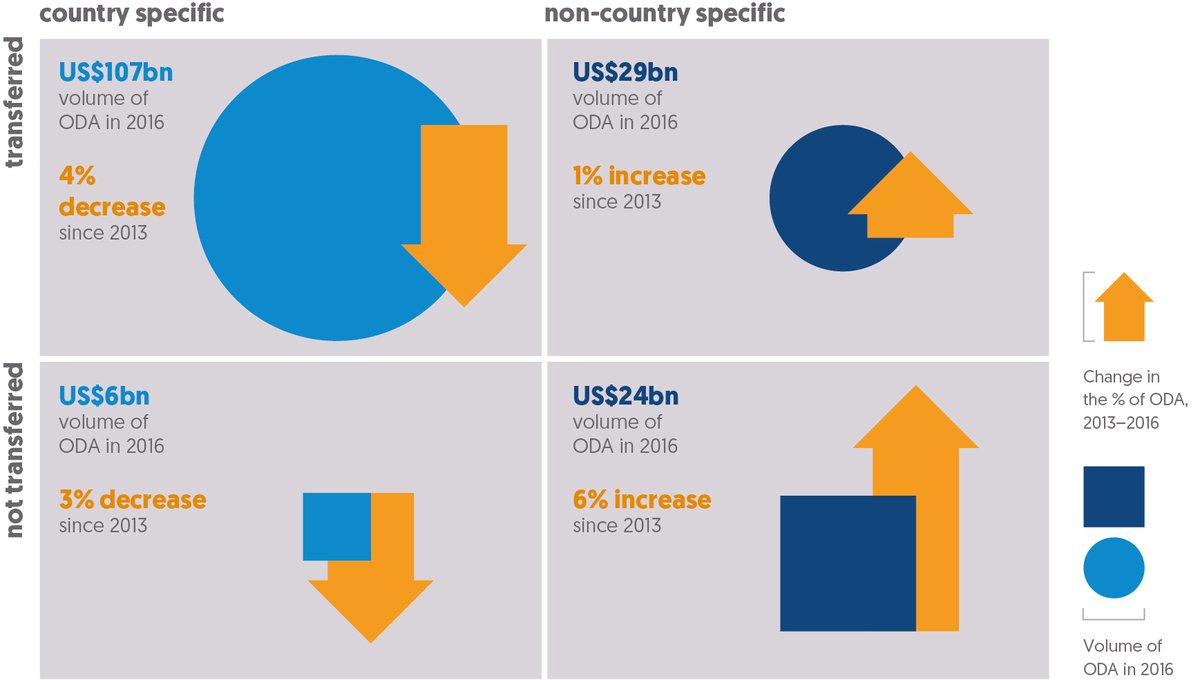
ODA spent within donor countries and not allocated to specific developing countries has risen rapidly
Source: Development Initiatives based on OECD DAC.
Notes: Arrows show direction of change in the proportion of each ODA category to total ODA between 2013 and 2016.
Of the US$166 billion in total gross ODA disbursed by DAC members and multilateral bodies in 2016, just US$107 billion was allocated to specific countries and in a form that resulted in an actual transfer of resources from the donor. This accounted for 69% of ODA in 2013 and had declined to 65% by 2016.
In 2016, US$30 billion of ODA was not transferred from donors and most of this (US$24bn) was not allocated to a specific recipient country. Indeed, the amount of ODA spent in donors’ countries and not reported as allocated for a specific country has risen sharply, from 9% of ODA in 2013 to 15% in 2016, driven by an almost four-fold increase in spending on refugees in donor countries. The proportion of ODA that never left the donor country rose from 15% of total gross ODA in 2013 to 18% in 2016. These trends need to be reversed if ODA is to address the needs of the poorest people first.
ODA that is allocated to countries is not benefiting the poorest populations proportionately to their needs
The ODA that does result in transfers to specific countries is not always targeted at the poorest places. While the largest proportion of ODA allocated to specific countries goes to sub-Saharan Africa (37% in 2016), few of the countries in this region receive the largest amounts of ODA overall and only Ethiopia is one of the largest eight recipients of aid (US$4.2bn). The others, apart from Turkey, are all in Asia and the Middle East: India (US$5.3bn), Afghanistan (US$4.1bn), Viet Nam (US$3.8bn), Pakistan (US$3.6bn), Bangladesh (US$3.2bn) and Syria (US$2.9bn).
Figure 2.6 Of the ODA allocated to specific countries, more than half goes to countries in sub-Saharan Africa and South and Central Asia (US$ bn, %)
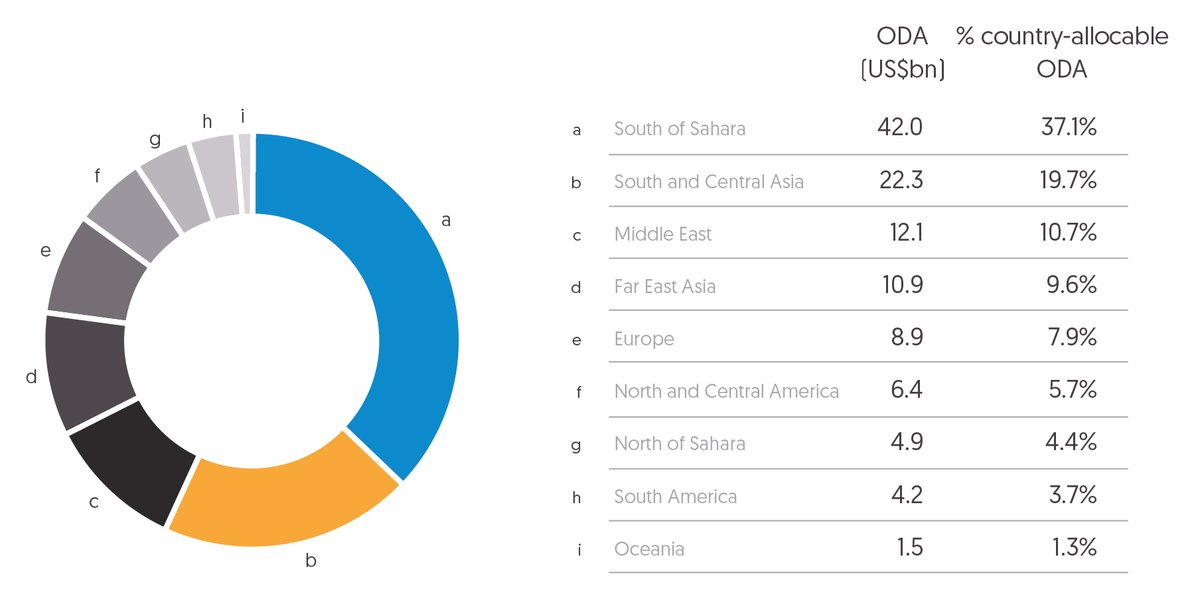
Of the ODA allocated to specific countries, more than half goes to countries in sub-Saharan Africa and South and Central Asia (US$ bn, %)
Source: Development Initiatives based on OECD DAC.
Looking at the prevalence of extreme poverty ($1.90 per day) [15] across countries, the amount of ODA received by countries with larger populations of people in extreme poverty is nowhere near proportionate. The countries that contain 75% of the world’s poorest people [16] received 35% of the ODA disbursed in 2016, and countries with less than 1% of the world’s poorest people received 25% of ODA.
Figure 2.7 There is only a small difference in proportions of ODA received by countries with the highest and the lowest levels of extreme poverty
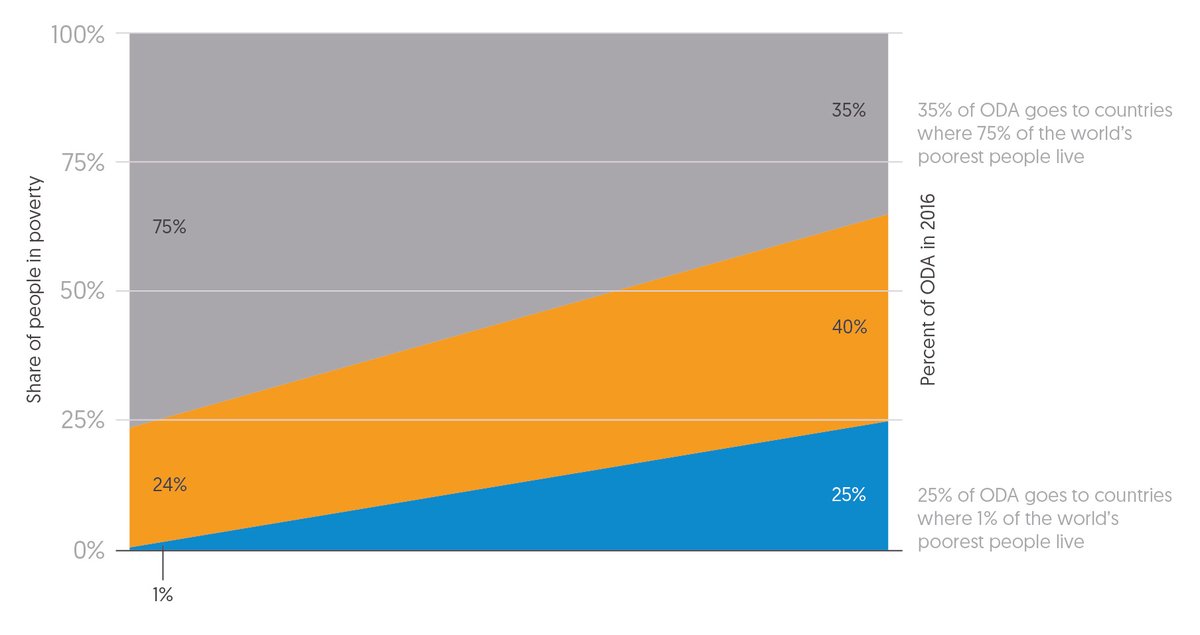
There is only a small difference in proportions of ODA received by countries with the highest and the lowest levels of extreme poverty
Source: Development Initiatives based on OECD DAC and World Bank PovcalNet.
Note: ODA data shown is for 2016 and only refers to country allocable ODA to countries with poverty data available.
When looking at ODA per poor person, it is far from shared equally among people in extreme poverty. In countries with less than 5,000 people in extreme poverty, it is over US$230,000 – more than 3,500 times higher than the ODA per poor person in countries with more than 10 million people in extreme poverty. Considered in this way, ODA allocations appear regressive – with proportionately more resources per poor person going to the countries with the least poverty.
Figure 2.8 Although more ODA goes to countries with more poor people…Figure 2.9 ... the amounts are nowhere near proportional to the scale of poverty
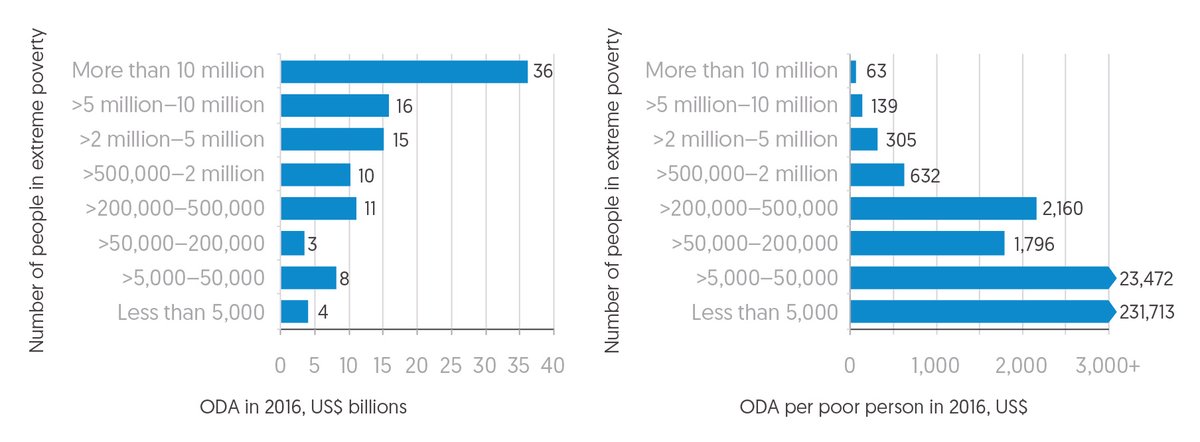
Although more ODA goes to countries with more poor people the amounts are nowhere near proportional to the scale of poverty
Source: Development Initiatives based on OECD DAC and World Bank PovcalNet.
Notes: Countries for which no poverty data is available have been excluded. Extreme poverty is defined by the $1.90 a day international poverty line (2011 PPP$: purchasing power parity) and is based on most recent data available. Bands were identified in such a way as to contain as even as possible a number of countries within them. Less than 5,000 and 5,000–50,000 bands are truncated on chart (2.9).
Similarly, countries with the lowest levels of government revenue are not proportionately benefiting from ODA
There is significant variation in the government resources available in developing countries. Some ODA recipients only have a few hundred dollars or less per person to spend on providing services, infrastructure and governance in their countries; others have thousands of dollars per person in government revenues. While more ODA does go to countries with less government resources, ODA disbursed to the low-revenue countries is not proportionate to the level of poverty in these countries. Countries with revenues of between $2,000 and $4,000 per capita get seven times as much ODA per poor person as countries with government revenues of less than $400 per capita. Countries with government revenues of above $4,000 per capita get three times as much ODA per poor person as countries with the lowest government revenues. This reflects a similar picture to ODA disbursed based on extreme poverty levels.
Figure 2.10 More ODA goes to countries with lower government resources... Figure 2.11 ...however, ODA per poor person is significantly lower in countries with low government revenues

More ODA goes to countries with lower government resources however, ODA per poor person is significantly lower in countries with low government revenues
Source: Development Initiatives based on OECD DAC, World Bank PovcalNet and International Monetary Fund (IMF) World Economic Outlook database and IMF Article IV Staff and programme review reports (various).
Notes: Countries for which no poverty data or government revenue per person data is available have been excluded. Extreme poverty is defined by the $1.90 a day international poverty line (2011 PPP$: purchasing power parity). Bands were identified in such a way as to contain as even as possible a number of countries within them.
ODA to the least developed countries has not kept pace and has flatlined in recent years
Another indication that ODA is not being targeted at countries with the greatest need is donors not prioritising the least developed countries (LDCs). LDCs are described by the UN as: “lowincome countries confronting severe structural impediments to sustainable development... highly vulnerable to economic and environmental shocks and have low levels of human assets”. [17] While ODA to LDCs grew fairly sharply in the early years of the century, this growth then slowed and has now flatlined, falling from 35% of ODA in 2010 to less than 30% in 2016.
ODA is not being sufficiently targeted to countries identified as being left behind
ODA allocations should also consider where poverty is likely to persist in the future. The countries referenced in Chapter 1 as at risk of being left behind currently account for 23% of global poverty, and on current projections will be home to around 80% of the world’s poorest people by 2030. Yet recent growth in ODA has mostly bypassed these countries. In fact, gross ODA to this group of countries has fallen by 6% since 2010, while ODA to all other recipients has risen by 32%.
Figure 2.13 ODA to countries identified as being left behind is flatlining while ODA spent elsewhere is growing
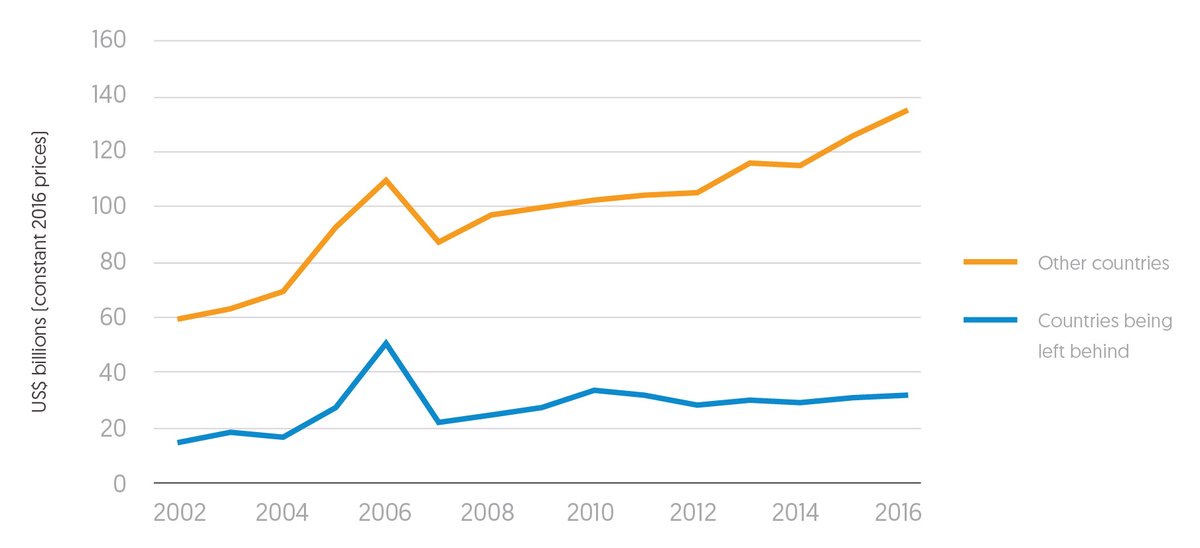
ODA to countries identified as being left behind is flatlining while ODA spent elsewhere is growing
Source: Development Initiatives based on OECD DAC.
Note: Other countries include other developing countries and regional and unspecified recipients.
Box 2.2
Understanding ODA's responsiveness to particular needs – a focus on climate change
As highlighted in Chapter 1, poverty is multidimensional and many complex factors make people vulnerable. This makes the targeting of issue-specific ODA important to understand. Climate change is one example –the relationship between climate change and poverty is now well known, yet it is not clear that this knowledge is translated into how and where climate-related ODA is allocated and whether it is effectively targeting the people who are most vulnerable to its effects. In 2016, around 145 countries received adaptation-related ODA [18] from DAC donors and multilateral institutions. Of the 20 largest recipients by volume, just 3 – Afghanistan, Uganda and Mali – could be described as the ‘most vulnerable’ to climate change based on data from the Notre Dame Global Adaptation Initiative (ND-GAIN). Many countries with relatively low levels of vulnerability received some of the largest amounts of adaptation-related ODA, including Turkey, Colombia and Jordan. Moreover, a very small proportion of their populations live in extreme poverty.
Figure 2.14 Adaptation ODA is not effectively targeting the people most vulnerable to climate change
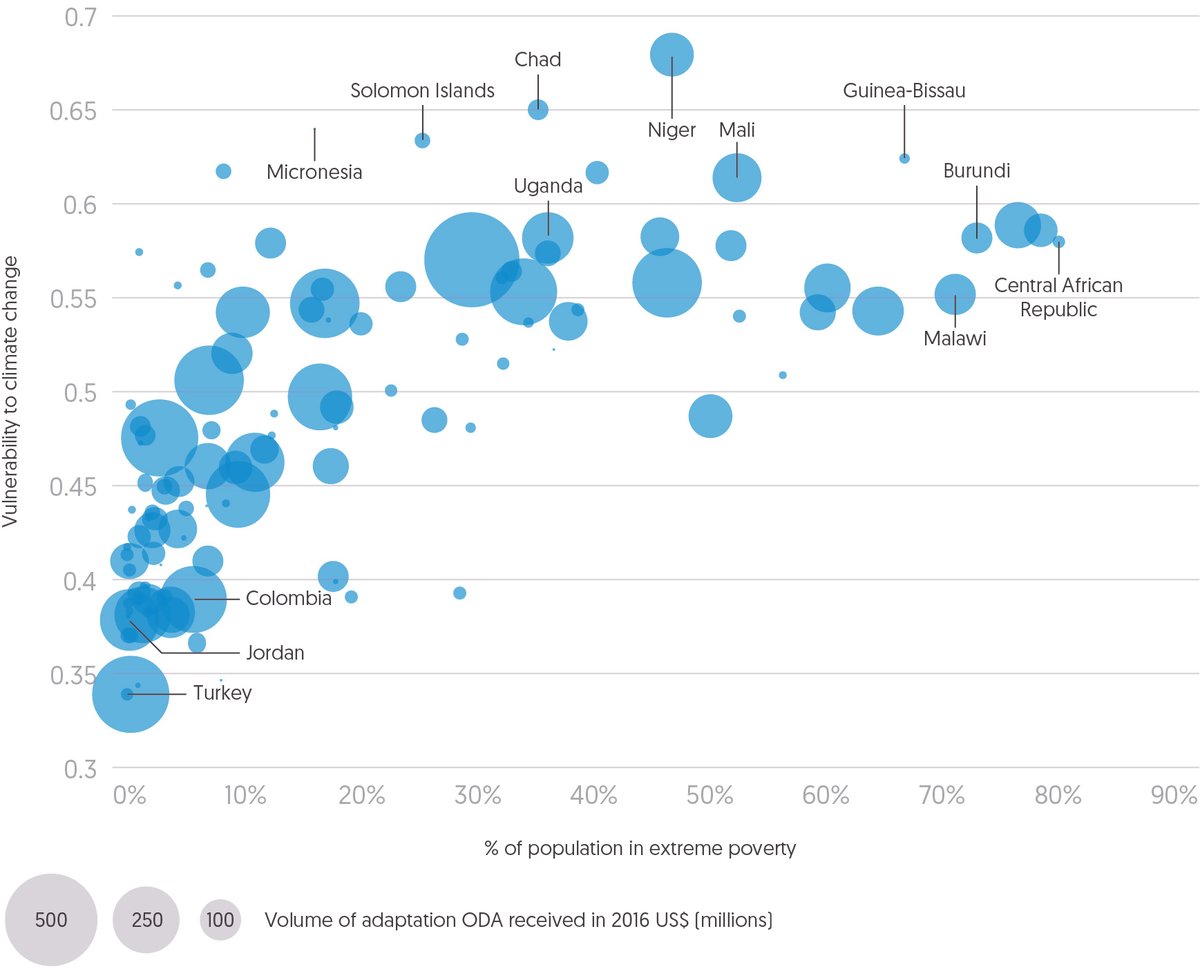
Adaptation ODA is not effectively targeting the people most vulnerable to climate change
Source: Development Initiatives based on OECD DAC Creditor Reporting System (CRS), Notre Dame Global Adaptation Initiative (ND-GAIN) and World Bank PovcalNet.
Notes: Amounts based on gross ODA disbursements. Includes ODA marked as principal and significant with the climate change adaptation policy marker. Regional and unspecified allocations are excluded. Size of bubble is relative to adaptation ODA in US$ (millions). Includes only countries for which there is data available for poverty, ODA and vulnerability
There is not much variation between countries classed as having medium [19] or low [20] levels of vulnerability. They received an average of US$49.8 million and US$42.2 million respectively. The countries with the greatest [21] levels of vulnerability receive relatively little – on average US$65.3 million per country. Some of the most vulnerable countries received the lowest amounts – including Eritrea (US$11.3m), Chad (US$24.6m), the Solomon Islands (US$15.9m) and Micronesia (US$0.2m). Furthermore, certain countries with high levels of vulnerability and relatively high levels of extreme poverty are not prioritised, for example Guinea-Bissau and Central African Republic.
Such gaps and inequality in the distribution of adaptation-related ODA, considering patterns of vulnerability and poverty, reveal significant opportunity for DAC donors and multilateral institutions to improve the targeting of their climate-specific resources.
Trends in ODA modalities show a significant shift towards loans and ODA resulting in no transfers
Various means (often described as modalities or instruments) are used to deliver ODA. Modalities describe how aid is managed and disbursed and can influence what, where and who is targeted. [22] The impact of changes in modalities, particularly on those people and places furthest behind, can be hard to see immediately. Yet there is little doubt that how aid is used matters almost as much as what aid is used for, with who and where . The global figures may also obscure important distinctions and variations at the level of each donor. Here the use of ODA as loans demonstrates those variations and the potential long-term impact on the poorest people.
A significant dividing line in types of modalities is how concessional aid is – grants are 100% concessional while other forms such as ODA loans or other financial instruments vary in their concessionality, requiring some form or proportion of repayment and can thus create debt.
Just as gross ODA has fallen for a number of the poorest countries since 2010, so grants directly to projects, a key modality for such countries, have also declined. They have fallen as a proportion of total ODA – from 42% in 2010 to 36% in 2016, as loans and non-transfer aid have taken a larger share of ODA. And when only grants allocated to specific countries or regions are considered (thus excluding those that have no specific geographical focus), volumes have flatlined. For LDCs they have actually fallen in real terms by 12%, at a time when lending to such countries has risen (see below). [23]
Core grants to NGOs have risen quite rapidly in recent years, up by over 50% since 2012 to US$3.6 billion in 2016. The great majority of this spending (US$3bn) was targeted at international NGOs and NGOs based in donor countries. Core grants to specific-purpose funds and pooled funds have grown faster than total ODA – by 32% since 2010 to US$18.4 billion in 2016, 11% of total ODA. However, as discussed in depth in this chapter, loans have also risen significantly.
Some equity investments in companies in developing countries, usually made by development finance institutions (DFIs), are eligible to be counted as ODA. These investments peaked in 2010 and 2011 at US$1.6 billion in both years. From 2012 to 2014 gross equity investments reported as ODA stood at US$1.4 billion per year. Since 2014, tracking the use of these instruments has been complicated by some donors choosing to report capital sums into DFIs from donor governments as ODA, rather than the actual investments made by the DFIs. In 2014, the UK reported US$445 million of equity investments from CDC Group (the UK DFI) as ODA. In 2015, CDC ceased to report the detail of its investments to the OECD; instead the Department for International Development reported a US$688 million investment into CDC as an ODA grant. As a result, total equity investments reported as ODA fell to US$1 billion in 2015 and 2016.
Another important dividing line is whether the modality results in a transfer of real resources from the donor country and, as noted earlier, non-transfer ODA has been on the rise in recent years. Finally, some forms of ODA do not result in a transfer of ‘cash’ resources but a transfer of knowledge, experience and capacity, for example technical cooperation. Since 2007 this has fallen by 2.7% as a proportion of total ODA but grown in dollar value by 16.7%.
The most significant trend over the last decade has been the increasing use, by some large donors in particular, of concessional loans as a way of delivering aid. Loans now make up almost a quarter of total ODA, growing three times faster than other ODA modalities combined from 2007 to 2016 (Figure 2.15). This has meant a rise from 15% of gross ODA in 2007 to 24% in 2016 despite compelling evidence on the negative or counter-productive effects on the poorest countries, for which low absorptive capacity and unsustainable debt can seriously affect their current and future economic growth. [24] , [25]
Figure 2.15 Loans have grown much faster than other forms of ODA in recent years
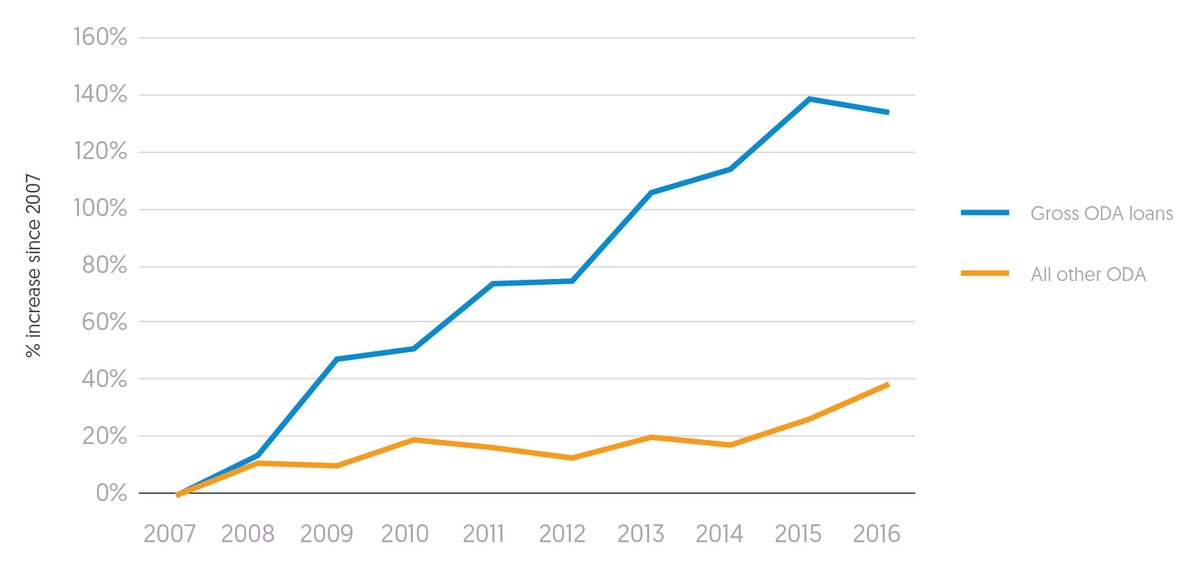
Loans have grown much faster than other forms of ODA in recent years
Source: Development Initiatives based on OECD DAC.
Notes: Chart is indexed from 2007 showing percentage rise in gross ODA loans and all other ODA for subsequent years.
Just four countries – Japan, Germany, France and Korea – supply 98% of ODA loans from DAC member countries. Japan has long been the lead provider of ODA loans among the DAC donors, however Germany, France and Korea have rapidly expanded their lending programmes between three and five-fold between 2007 and 2016. Institutions of the EU, the only multilateral donor that is a member of the DAC, increased levels of ODA loans by a factor greater than 40 over the same period.
A substantial amount of lending goes to countries deemed in debt distress or at risk of being so, indicating donors are not consistently showing due diligence
Crucially, the rise in loans in recent years has been evenly spread across countries of different income groups, with no significant changes in the proportion of loans going to any particular income group between 2007 and 2016. This means many countries with high poverty levels and low government revenues are receiving large amounts of ODA loans. Looking further at low income countries, over 30% of the loans going to these countries were assessed by the International Monetary Fund as being lent to countries in or at high risk of being in debt distress.
In Africa significant volumes of loans went to countries at high risk of debt distress in 2016, including Ethiopia (US$1.5bn) Ghana (US$656m) and Cameroon (US$391m). Mozambique, a country rated as actually being in debt distress, received loans totalling US$417 million in 2016.
Figure 2.16 Large amounts of ODA loans in 2016 went to countries with high poverty levels... Figure 2.17...and to countries with low government revenues
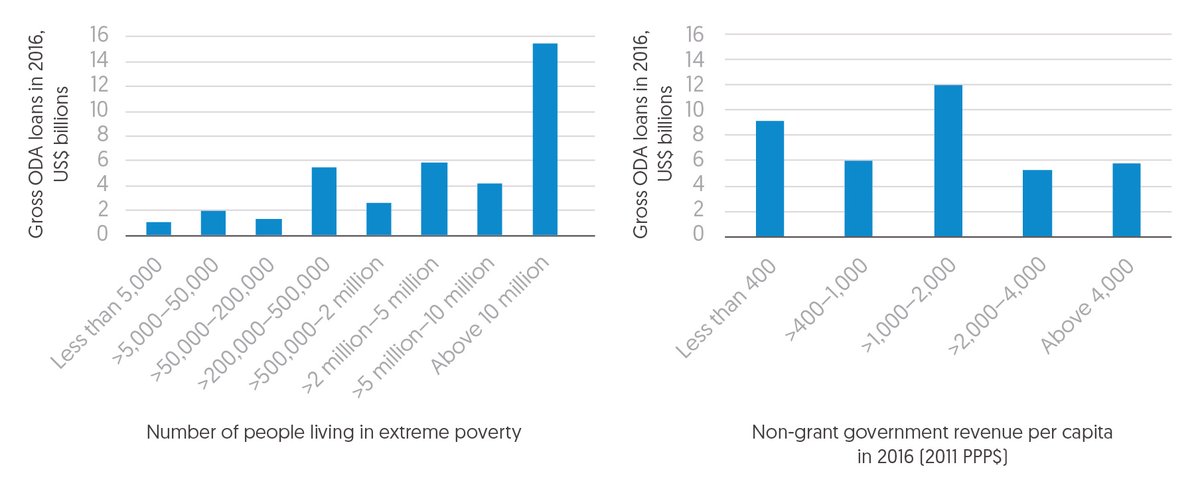
Large amounts of ODA loans in 2016 went to countries with high poverty levels and to countries with low government revenues
Source: Development Initiatives based on OECD DAC, World Bank PovcalNet (Figure 2.16), IMF World Economic Outlook database and IMF Article IV Staff and programme review reports (various) (Figure 2.17).
Notes: Countries for which no poverty data is available have been excluded. Extreme poverty is defined by the $1.90 a day international poverty line (2011 PPP$: purchasing power parity). Bands were identified in such a way as to contain as even as possible a number of countries within them.
Significant volumes of ODA are being dispersed by a wide range of government departments and channelled outside countries' domestic government and civil society institutions
As well as being delivered in a variety of modalities, ODA is channelled by and through a complex network of agencies and actors. Most donors have a dedicated aid agency or development specialists in foreign affairs ministries to disperse ODA. However, certain donors such as the UK are making a conscious effort to push spending increasingly via other departments. [26] ODA being administered by such ‘other’ government ministries accounted for 30% of ODA reported by DAC donors in 2016. Interestingly, small amounts of ODA from some donors also come from local, regional or municipal government bodies – just over US$2 billion in 2016.
With growing emphasis on the role of the private sector in promoting development, it is expected that bilateral DFIs may in future account for a larger proportion of ODA (see Chapter 3). At present, however, their contribution is fairly small – accounting for just under US$6 billion of ODA in 2016.
Figure 2.18 The flow of ODA in 2016 (US$ bn)
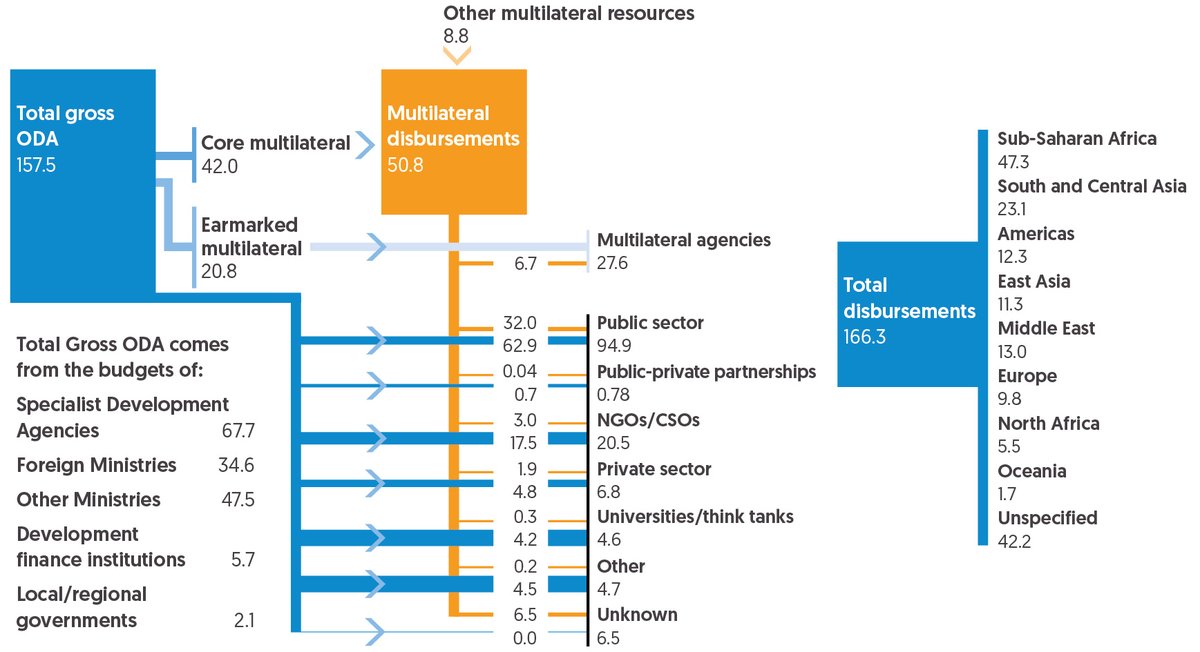
The flow of ODA in 2016 (US$ bn)
Source: Development Initiatives based on OECD DAC.
Note: ‘Other multilateral resources’ represent funds disbursed by multilateral bodies over and above the resources transferred to these organisations by donors in a given year. This may include core funding carried over from previous years or, in the case of development banks, amounts drawn from profits on lending activities.
Most ODA is channelled via public sector institutions, but significant portions bypass local or national actors
Over half of all ODA is channelled via public sector institutions. Of this, a third (33%) is implemented by the donor government directly, with a larger 57% via the government of the recipient country. For aid not channelled via the public sector, the great majority is implemented by international rather than local actors. [27] International multilateral agencies account for 17%, the second-largest amount of ODA being channelled, two thirds of which is via the UN. NGOs channel a similar amount (12%); almost all of this is channelled through organisations headquartered in donor countries. Finally, the private sector only accounts for 4% with over half (54%) via firms in the donor country. These proportions of total ODA have remained almost static since comprehensive data became available as channel of delivery began to be reported by donors in 2009.
Donors and implementing agencies have committed to providing more humanitarian funding as directly as possible to local and national actors who are regularly the first to respond in humanitarian crises. To date, volumes of reported international humanitarian assistance are well below the 2020 target agreed in the Grand Bargain of 25% of all assistance. [28] In 2017, 3.6% of international humanitarian assistance reported to UN Office for the Coordination of Humanitarian Affairs (OCHA)’s Financial Tracking Service was delivered directly or through one intermediary to local and national responders. [29]
Figure 2.19 Overall, most ODA is channelled via public-sector bodies
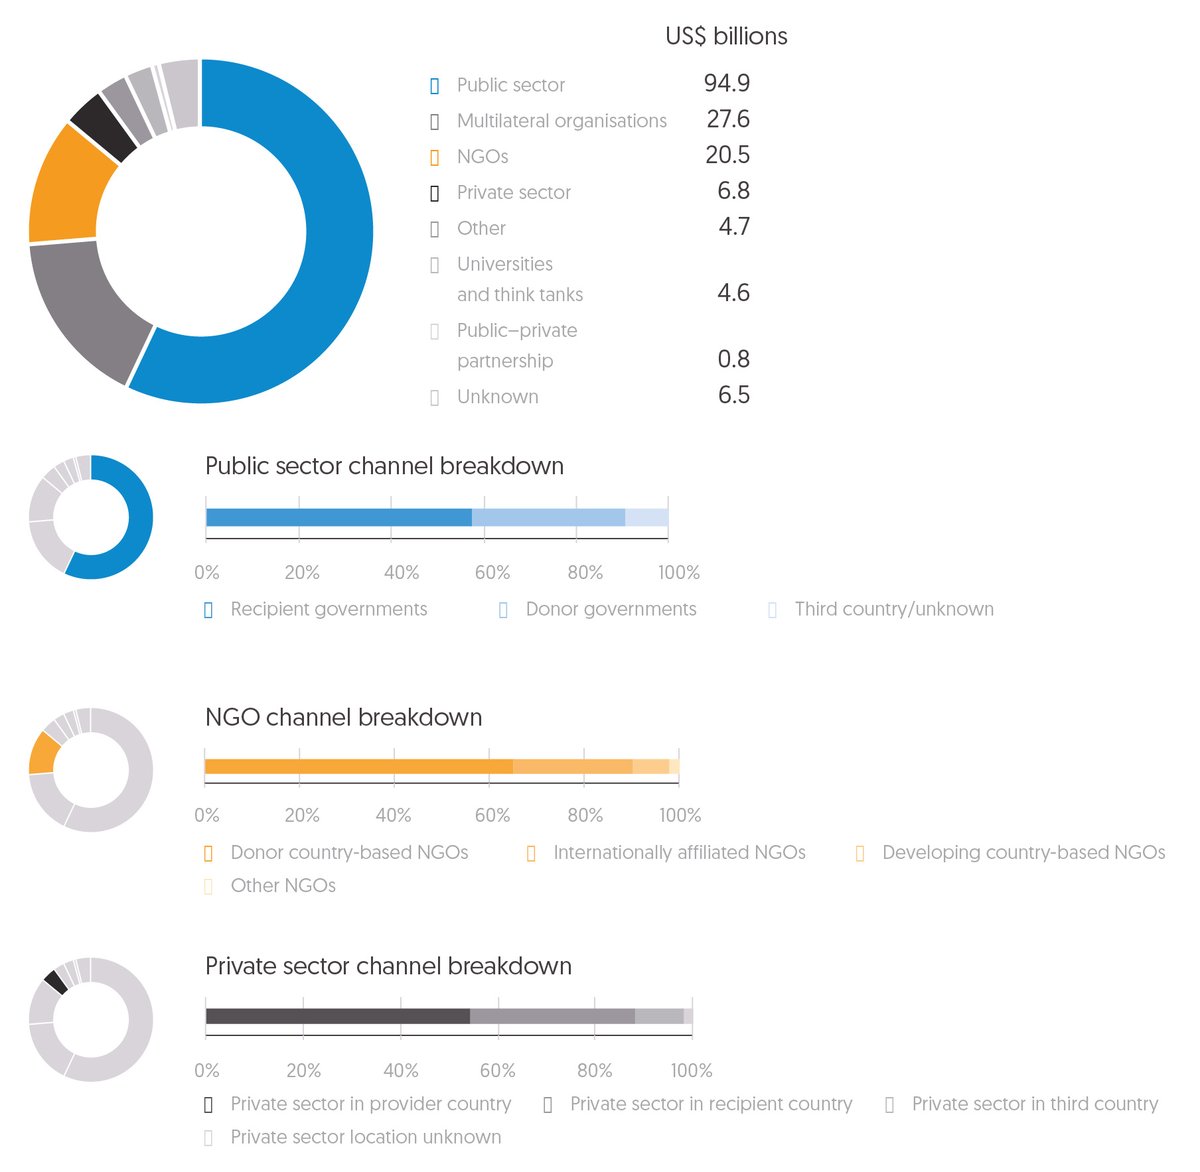
Overall, most official development assistance is channelled via public sector bodies.
Source: Development Initiatives based on OECD DAC Creditor Reporting System (CRS).
Note: The channel of delivery refers to the first implementing partner of the ODA disbursement, which has implementing responsibility over the funds.
There are variations in aggregate totals when looking at different sets of countries, with less ODA to countries at risk of being left behind being channelled through government institutions than is the case for other countries. In fact, the proportion of ODA channelled via the public sector in countries being left behind has declined noticeably since 2011. Between 2008 and 2011 around 50% of ODA to countries being left behind went through the public sector, but this proportion declined in each year from 2011 to 2016. ODA to this group of countries is more than twice as likely to be channelled through a multilateral body or NGO than other ODA. To some extent this is unsurprising as the poorest and most vulnerable countries may have weaker government institutions, if present at all, via which ODA can be administered. However, this is not the case for all countries being left behind, some politically fragile countries may have functioning subnational institutions. Yet their low levels of government revenue make ODA channelled via their government institutions all-the-more vital if they are to be empowered to lead their own development agendas. [30] There is clearly substantial scope for donors to work better through local institutions – state and non-state. [31]
Figure 2.20 Less ODA is channelled through the public sector in countries being left behind
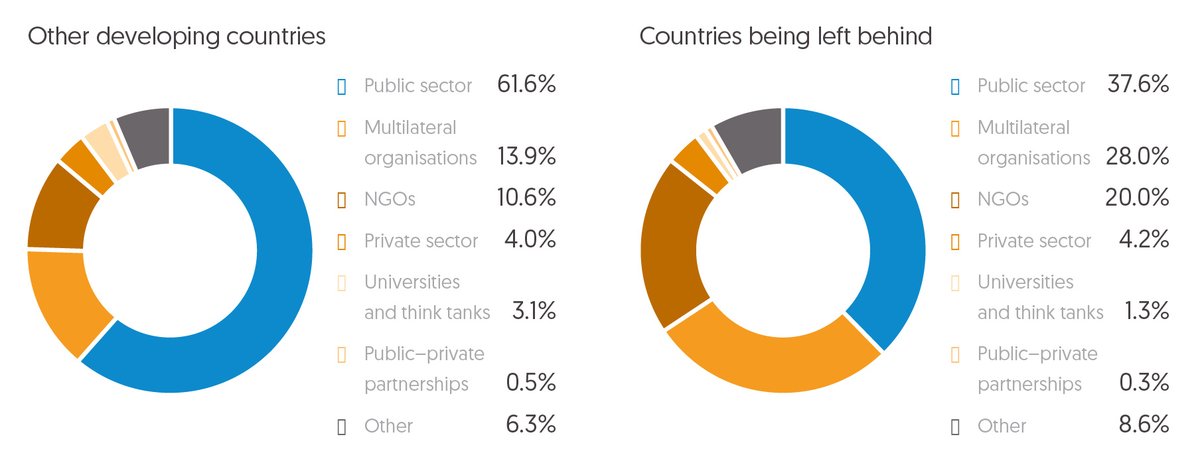
Less official development assistance is channelled through the public sector in countries being left behind
Source: Development Initiatives based on OECD DAC Creditor Reporting System (CRS).
Notes: Data is for 2016. The channel of delivery refers to the first implementing partner of the ODA disbursement, which has implementing responsibility over the funds.
ODA is not consistently targeting the sectors most critical to leaving no one behind
ODA supports a wide range of activities and health, infrastructure and governance-related sectors consistently receive the largest amounts. In 2016, these three sectors combined accounted for more than a third of gross ODA disbursements (health 13%, infrastructure 12% and governance 10%).
Humanitarian aid has risen notably faster than total gross ODA, with proportions of total aid almost doubling from 6% in 2006 to 11% in 2016 (see Chapter 5 for a discussion of implications). Another significant rise is in spending on refugees in donor countries, which typically accounted for around 2 to 3% of total ODA before 2014 but has increased almost four-fold to US$16 billion in 2016, 10% of total gross ODA. [32]
Figure 2.21 Humanitarian aid has grown more quickly than other ODA since 2012
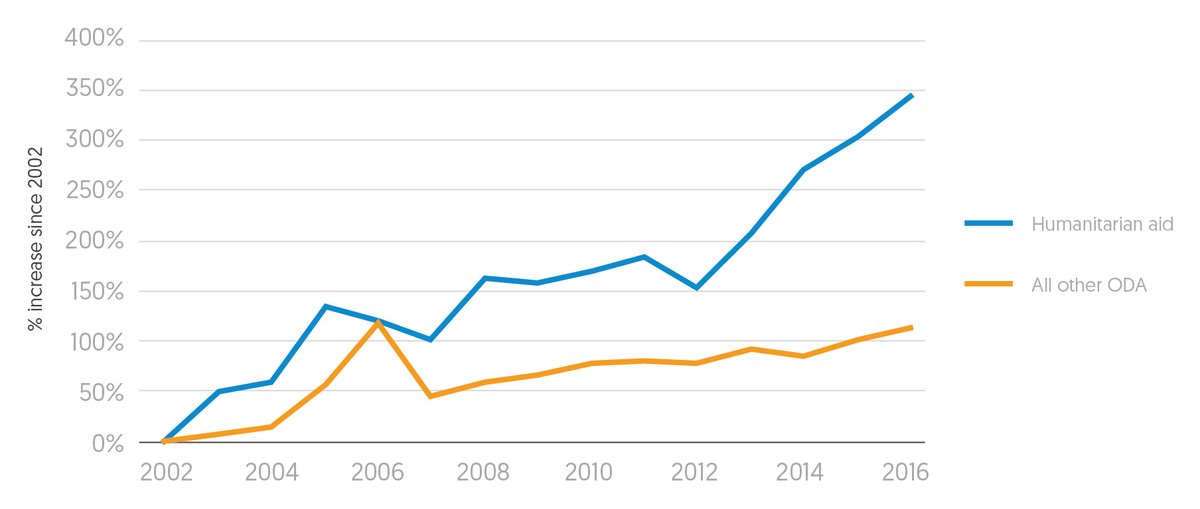
Humanitarian aid has grown much more quickly than other ODA since 2012
Source: Development Initiatives based on OECD DAC Creditor Reporting System (CRS).
Note: Chart is indexed from 2002 showing percentage rise in humanitarian aid and all other ODA for subsequent years.
Focusing in on development ODA, a broad range of sectors receive significant amounts of aid, with notable trends related to a number of the sectors that should be the greatest priorities to ensure no one is left behind. Spending on health has stagnated since 2013 after a 250% increase between 2002 and 2013. ODA to education has also remained fairly static, only rising by 6% in real terms between 2010 and 2016. This means the share of total ODA going to education slipped from 8.4% to 7.3% over that period.
Other social services (social services excluding health and education) saw the slowest growth, with spending rising well below the rate of ODA as a whole. In fact, spending on this sector was over 20% lower in 2016 than a peak year in 2008. Although there is no data specifically on ODA to social protection, ODA to social and welfare services, a subdivision of other social services that largely comprises spending on social protection, is tracked. ODA spent here peaked in 2010 at US$2.6 billion before dropping to US$1.7 billion in 2012. Since then such aid recovered to US$2.4 billion by 2016 – although still only 1.4% of total ODA. Data on ODA support for social protection programmes may improve in coming years as the OECD has updated its data to allow donors to track spending on social security, pensions and other social protection schemes in the form of cash or in-kind benefits.
Finally, general budget support [33] has been cut substantially – falling from over 5% of ODA in 2009 to just 1.7% in 2016. This is particularly pertinent since the Busan Partnership for Effective Development Cooperation made country ownership one of its stated principles for effective development. [34] Budget support was widely viewed as a key mechanism through which aid would be delivered in such a way as to increase country ownership of development outcomes. [35]
Figure 2.22 Proportions of ODA to Education, Other social services and General budget support have fallen
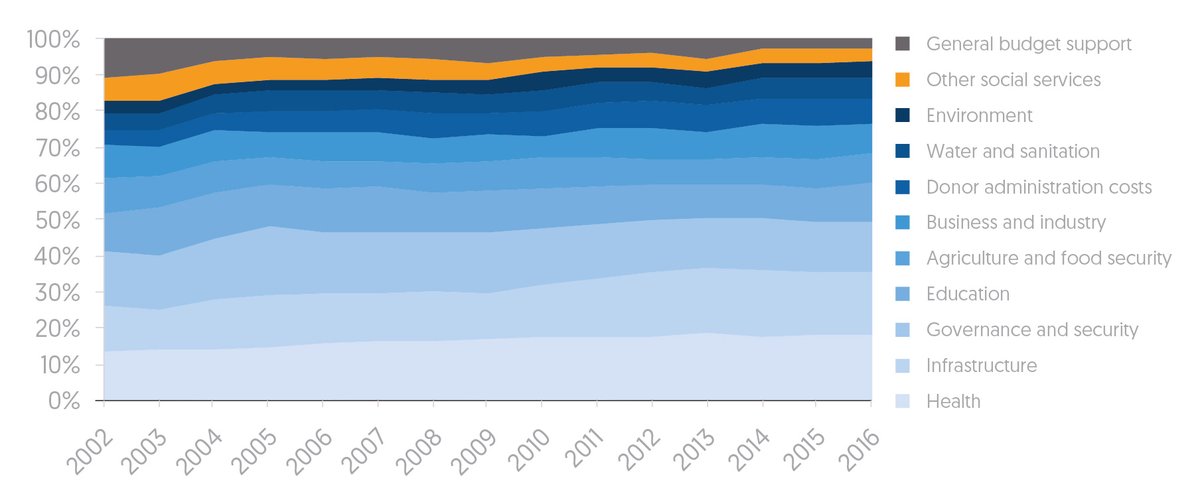
Proportions of ODA to Education, Other social services and General budget support have fallen
Source: Development Initiatives based on OECD DAC Creditor Reporting System (CRS).
Note: Chart excludes humanitarian assistance, in-donor refugee costs, debt relief, other commodity assistance, multisector ODA and ODA not specified to a sector.
When focusing in on different countries, there are clear variations from the aggregate trends on sector allocations. Many of these variations are to be expected. For example in countries with high levels of extreme poverty (more than 20% of the population living on less than US$1.90 per day) 30% of developmental [36] ODA is spent on health and 13% on infrastructure projects. In countries with lower levels of poverty (less than 5% of the population living on less than US$1.90 per day) the reverse is true, with 27% of developmental ODA spent on infrastructure and less than 5% on health.
However, looking at sectors that are particularly significant to ensuring the people furthest behind are lifted out of poverty, there are some surprising trends. ODA spending on education in countries with high poverty levels was US$1.2 billion lower than the amount given to countries with the lowest levels of poverty. Spending on water and sanitation projects is also higher in low poverty developing countries (US$2.5bn) than in high poverty countries (US$2.0bn).
Figure 2.23 There are clear differences across sector allocations of ODA between countries at different levels of extreme poverty
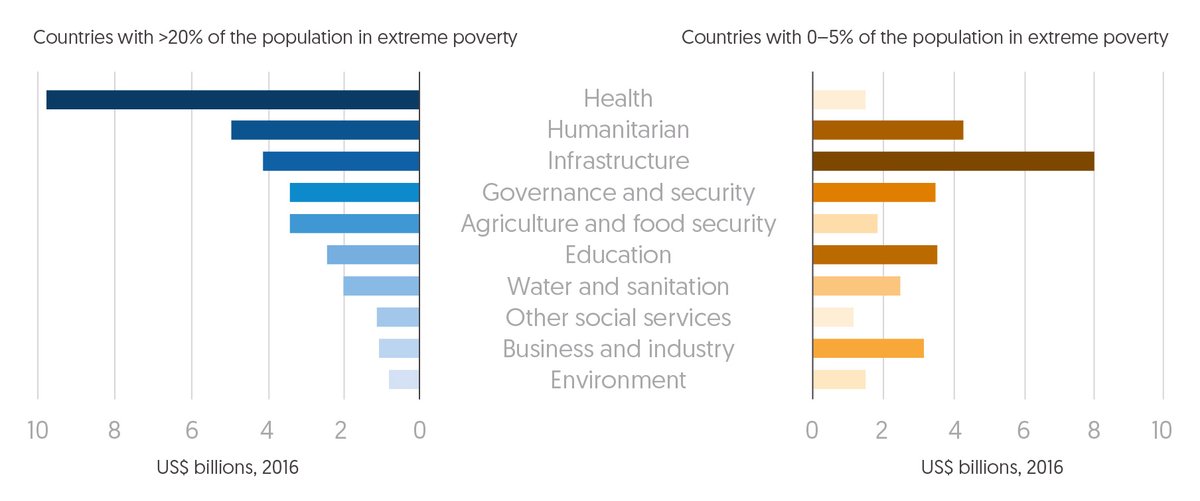
There are clear differences across sector allocations of ODA between countries at different levels of extreme poverty
Source: Development Initiatives based on OECD DAC and World Bank PovcalNet.
Note: The poverty bands were drawn for each group to contain similar amounts of total ODA to allow the analysis to demonstrate that differences in total volumes are not the main source of any differences in sector allocations.
With increasing focus on donors attracting private sector investment in developing countries, it is also important to acknowledge trends in ODA spending on business and industry in developing countries. At present countries with the lowest levels of poverty are receiving large amounts of ODA targeted at these sectors, meaning investments are primarily targeting where there is the least risk and greatest chance of receiving a profitable return. [37] This could call into question such ODA allocations on the basis that billions of dollars of donor funding may be going to the same areas that could instead benefit from private investment. If this is the case, it should incentivise donors to redeploy ODA to countries and sectors that are otherwise underfunded.
Countries being left behind receive the least investment in infrastructure and business and low amounts to education – with potential ramifications for human capital
Focusing in on the countries being left behind, allocations are largely as expected. Humanitarian aid and health dominate. They comprise almost half of gross ODA received and account for the largest increases (see Figure 2.25). Meanwhile the proportion of ODA allocated to infrastructure, business and industry is substantially lower than for other countries. Similarly, the trend in education follows the same surprising disparity seen when comparing countries based on income poverty levels. In fact, the amount being allocated to education in countries being left behind is falling.
Another worrying trend is the decline in general budget support. As reflected globally, the relative significance of this modality has continued to fall, and accounts for one of the largest proportional decreases, from 14% in 2002 to just 3% in 2016.
A number of countries being left behind are characterised by fragility and political insecurity. However, despite large and growing volumes of aid to humanitarian assistance, aid for conflict prevention and peacebuilding is low, accounting for US$1.1 billion, or 3% of aid to countries being left behind in 2016. This reflects trends of funding to fragile states more widely, where commitments in these areas have largely stagnated since 2010. Conflict prevention now accounts for just 2% of aid to fragile states, and peacebuilding just 10%.
Figure 2.24 Sector allocations of ODA to countries being left behind and other developing countries differ, but social protection remains among the lowest for both
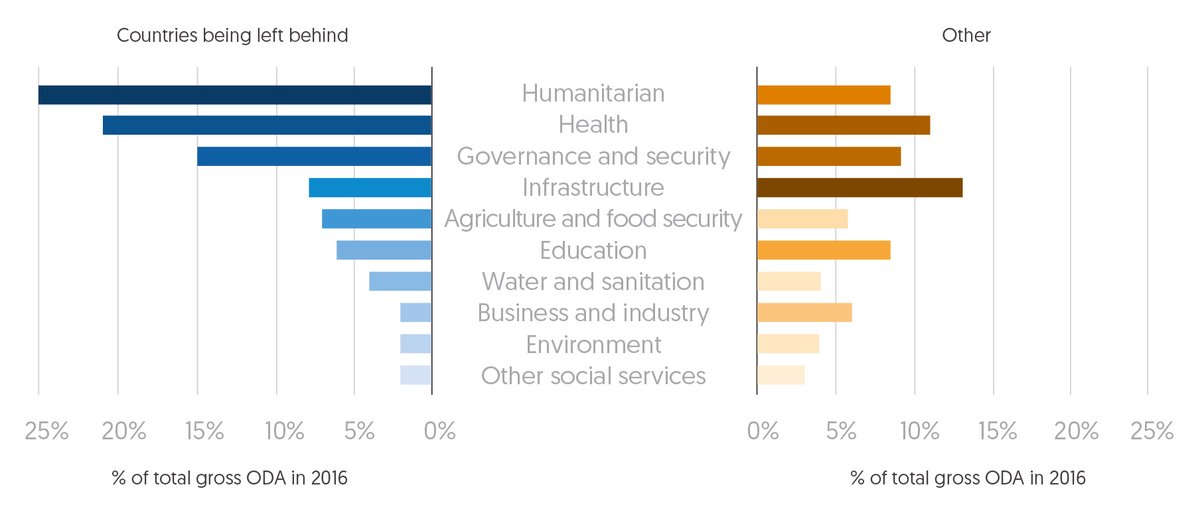
Sector allocations of ODA to countries being left behind and other developing countries differ, but social protection remains among the lowest for both
Source: Development Initiatives based on OECD DAC Creditor Reporting System (CRS).
Note: 'Other' includes ODA to regional and unspecified recipients. Percentages on chart will not total to 100 due to the exclusion of ODA to debt relief, general budget support and other sectors including donor admin costs and refugee hosting costs on the chart.
Figure 2.25 Since 2002, ODA to countries being left behind has become increasingly concentrated on health and humanitarian interventions, while budget support and aid to business and education has fallen
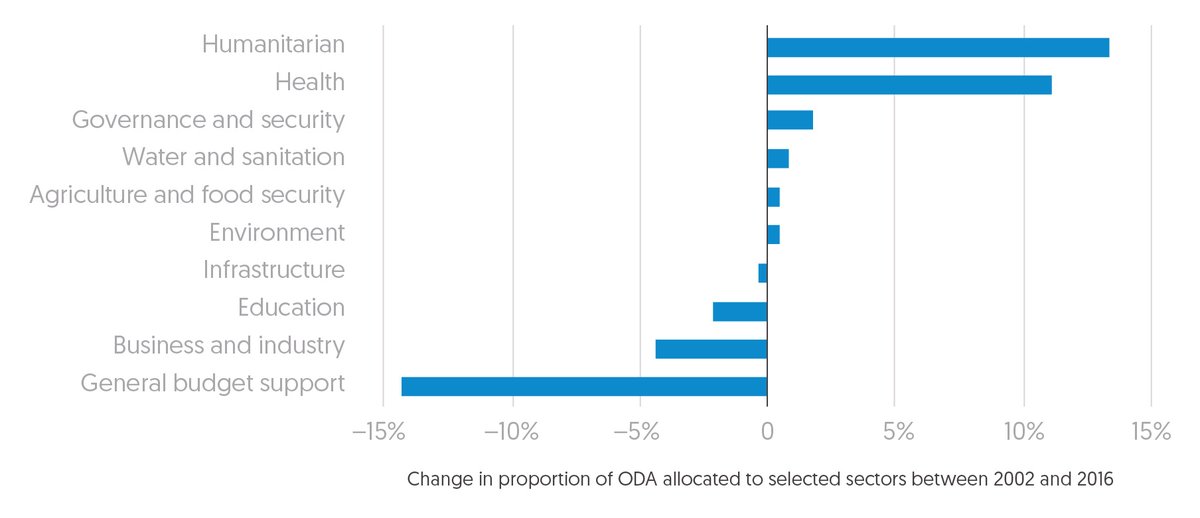
Since 2002, ODA to countries being left behind has become increasingly concentrated on health and humanitarian interventions, while budget support and aid to business and education has fallen
Source: Development Initiatives based on OECD DAC Creditor Reporting System (CRS).
Development cooperation from other government providers has seen significant increases in recent years
Levels of development cooperation from government providers outside the OECD DAC, including South–South cooperation [38] and ODA from other government providers, have increased significantly since 2000 and stood at US$25 billion in 2016. It is therefore important to acknowledge these volumes alongside ODA as, while classified differently, their purpose is aligned. Figure 2.26 shows development cooperation from three types of provider: developing countries not reporting ODA to the OECD (South–South cooperation), developing countries reporting ODA to the OECD (South–South ODA) and non-developing countries which are not members of the OECD DAC, but which report ODA to the OECD (ODA from other government providers).
Figure 2.26 Total development cooperation from other government providers stood at US$25 billion in 2016
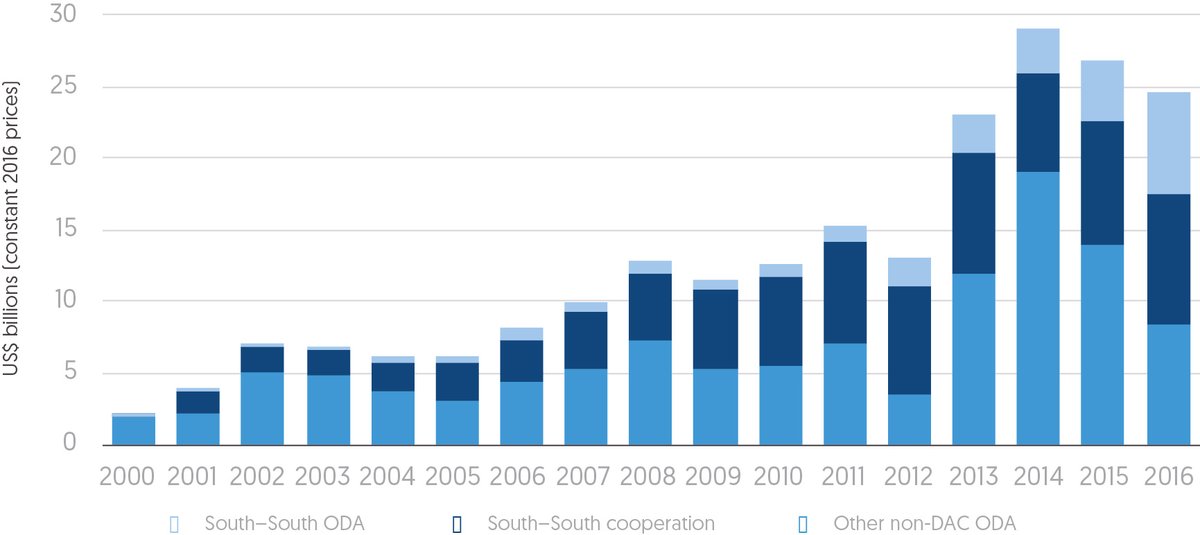
Total government cooperation from other government providers stood at twenty five billion US dollars in 2016
Source: Development Initiatives based on OECD DAC, JICA Research Institute, Government of India Union Budget, South Africa National Budget, Brazil ABC and IPEA, Mexican Agency for International development Cooperation and other national sources.
Note: Composition of data and definitions of development cooperation can vary by provider.
South–South cooperation and South–South ODA combined have grown in particular from just US$1.7 billion in 2001 to US$16.2 billion in 2016, of which Turkey (US$6.9bn), China (US$6.6bn) and India (US$1.8bn) were the largest donors. [39] ODA from other government providers – from developed countries reporting to the OECD but not DAC members such as the United Arab Emirates, Kuwait and European donors like Bulgaria – has also increased overall to US$8.4 billion largely due to spending by Gulf donors.
Data remains sparse, patchy and incomplete for much South–South cooperation and volumes may be underestimated. There are also significant challenges in assessing where it is going, what it is being spent on and what impact it is achieving. While volumes are smaller than ODA or other resources such as foreign direct investment, they are clearly rising and these actors are likely to play an increasing role in the future.
While Southern providers consider such flows as unique relationships based on solidarity and expressed through collaboration rather than reflecting a ‘donor–recipient’ transaction, this does not mean that accountability and transparency are any less important. Understanding better the contribution such actors are making, or could make, will be important to identify where they can most add value to countries’ needs in relation to other types of assistance. It could also ensure they are mobilising these flows effectively in support of Agenda 2030 in a transparent and accountable way.
Downloads
Notes
-
1
Poverty data exists for 124 of the 146 countries that receive ODA. In this group of 124, 35% of gross ODA goes to countries home to 75% of the people living on less than $1.90 per day. Also in this group of 124, 25% of gross ODA goes to countries home to 1% of the people living on less than $1.90 per day.Return to source text
-
2
Hynes W. and Scott S, 2013. The Evolution of Official Development Assistance: Achievements, Criticisms and a Way Forward. OECD, Paris. Available at: http://dx.doi.org/10.1787/5k3v1dv3f024-enReturn to source text
-
3
UN, 1970. International Development Strategy for the Second United Nations Development Decade, 24 October 1970. Available at: www.un-documents.net/a25r2626.htmReturn to source text
-
4
UN, 1970. International Development Strategy for the Second United Nations Development Decade, 24 October 1970. Available at: www.un-documents.net/a25r2626.htmReturn to source text
-
5
UN Sustainable Development Knowledge Platform. France Voluntary National Review 2016. Available at: https://sustainabledevelopment.un.org/memberstates/franceReturn to source text
