Food poverty: Key findings and trends 2000−2023
This factsheet provides an update on food poverty since our 2020 publication. It explains food poverty, how it is measured and analyses key findings between 2000 and 2023 at global, regional and national levels.
DownloadsOverview
This factsheet takes an up-to-date look at food poverty globally, regionally and nationally, using data from 2000 to 2023. Based on national sources, Development Initiatives has calculated the rate of food poverty across 121 economies, with data available for over three-quarters of the world’s population. [1] Since our last factsheet on food poverty, published in early 2020, there has been a reversal of progress in reducing food poverty globally. We show that the Covid-19 pandemic and the war in Ukraine are projected to have had a considerable impact on this.
See the Box for more information on what it means to live in food poverty and how it is measured.
Box
What does it mean to live in food poverty?
To live in food poverty is to lack the means to obtain enough food to live a healthy life. People living in food poverty have an income or expenditure that is less than the amount needed to consistently afford a basket of food with the minimum recommended nutritional intake. The cost of this basket is called a food poverty line. People living below the food poverty line are not able to afford the cost of food necessary for good health. This leaves them in danger of malnutrition, disease or ill health.
The monetary value of a food poverty line is most often based on the cost of affording a minimum energy intake using locally available goods − this is known as the food energy intake method. A global standard for the threshold of food poverty is 2,100 kcal per adult per day, which is the Food and Agriculture Organization’s recommended daily energy intake to enable an adult to live a healthy and moderately active life. [2]
As the costs of non-food essentials are not included, the food poverty line is often considered the most extreme measurement of monetary deprivation. Higher poverty measures, such as national poverty lines, consider the cost of a combination of both food and non-food essentials (for example, housing, clothing, education, and access to water, sanitation and electricity). People living in food poverty are forced to choose between food and non-food essentials on a daily basis.
How is food poverty measured?
Food poverty is measured using data from national household surveys which capture household income and/or expenditure data. [3] If a household’s average per-person income or expenditure is less than the food poverty line, all individuals in the household are considered to be in food poverty. [4] In this way, food poverty is an imperfect measure of individual deprivation, as it does not consider divisions below the household level. It also does not account for populations not captured by household surveys, many of whom are likely to be at higher risk of deprivation.
Food poverty lines themselves are created from household surveys that measure food consumption patterns and the prices of local foodstuffs. Food poverty lines are then set by national statistical offices, such that they reflect the local cost of food. Thresholds may be created for subnational regions, reflecting different prices or consumption patterns of food; many economies use differing thresholds of food poverty in urban and rural areas.
Tracking the number of people living in food poverty globally is not straightforward. Unlike extreme poverty − which has a single, fixed poverty line globally − the threshold of food poverty varies depending on the local cost of food and consumption behaviours.
► Read more from DI about poverty
► Share your thoughts with us on Twitter or LinkedIn
► Sign up to our newsletter
Key facts
Global trends in food poverty
- Between 2020−2023, progress in reducing food poverty globally has reversed. 571 million people are living in food poverty in 2023 − 42 million more people than in 2019.
- However, the global share of people living in food poverty decreased consistently between 2000 and 2019. It has decreased from 17% of the world’s population to 6.9%, representing 529 million people.
- The average annual rate of people escaping food poverty has been less than half the escape rate of extreme poverty since 2010.
Regional trends in food poverty
- People living in food poverty are increasingly concentrated in Africa and the Middle East. These regions represent 70% of people living in food poverty in 2023, compared to 29% in 2000.
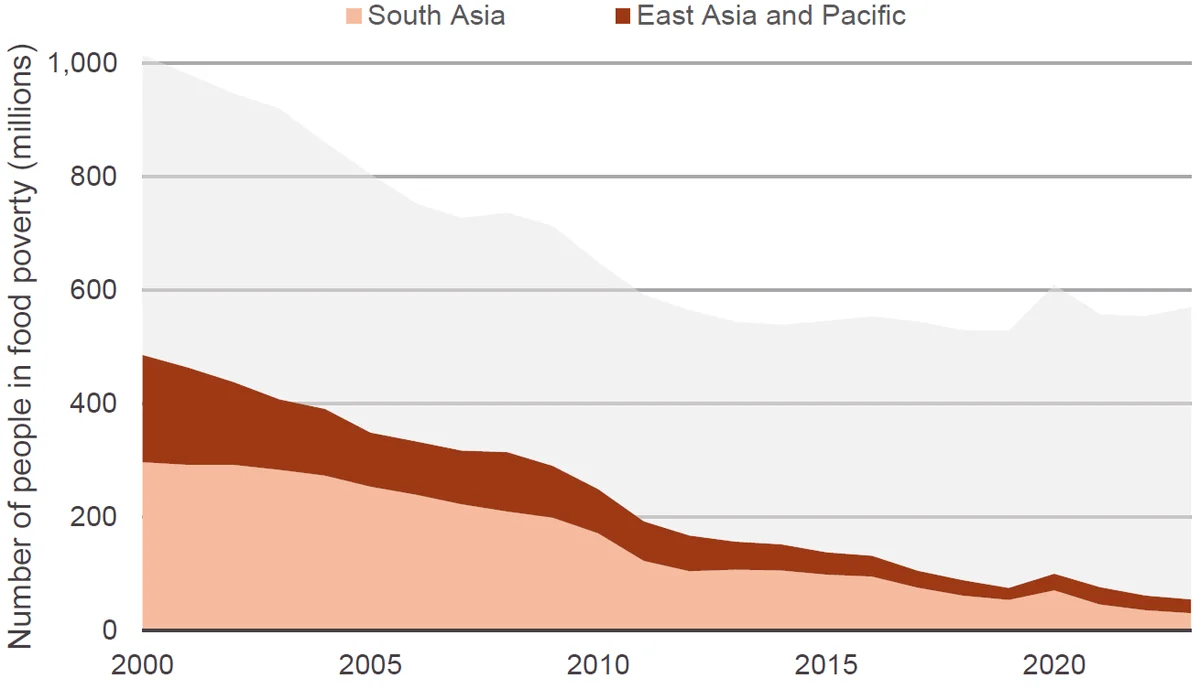
- Rates of food poverty have dropped significantly in South and East Asia since 2000, falling from 485 million people in 2000 to 55 million people in 2023.
National trends in food poverty
- In 11 countries, more than half of the population are living in food poverty in 2023. Between them they represent almost one-third of the global population in food poverty.
- Since 2010, rates of food poverty have increased for 43 countries. More than half of these countries are located in Africa and the Middle East. Rates of food poverty have more than doubled in 13 countries.
Global trends in food poverty
In 2015, the Sustainable Development Goals (SDGs) enshrined the target of ‘ending poverty in all its forms everywhere’ as the first goal. Ending food poverty is an intrinsic requirement of the SDGs. Food poverty is the most extreme form of destitution − people living in food poverty cannot afford the necessary food to live a healthy life and are forced to forgo food to afford non-food essentials. By ending poverty in all its forms, no one should remain in food poverty by 2030.
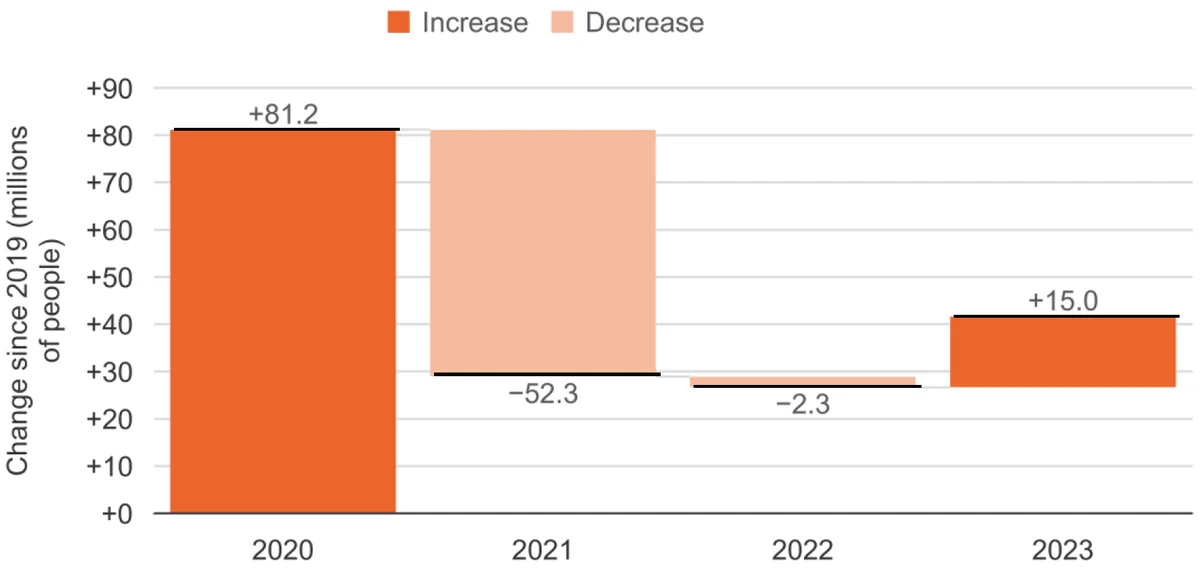
Between 2020−2023, there has been a reversal of progress in reducing food poverty globally…
The Covid-19 pandemic and war in Ukraine have contributed to a general reduction in income levels and an increase in food prices. Taken together, this is projected to have had a considerable impact on rates of food poverty. In 2020, the number of people in food poverty was estimated to have increased by 81 million to 610 million. This increase represented a 10-year reversal, with the number of people living in food poverty reaching the same level as in 2011. While it is estimated that this reversal somewhat recovered in 2021, the same progress has not continued, with numbers projected to rise again by 15 million to 571 million in 2023. This represents 42 million more people living in food poverty than in 2019.
Figure 1: Annual change in number of people living in food poverty globally, 2020−2023
…despite the global share of people living in food poverty decreasing year-on-year between 2000 and 2019
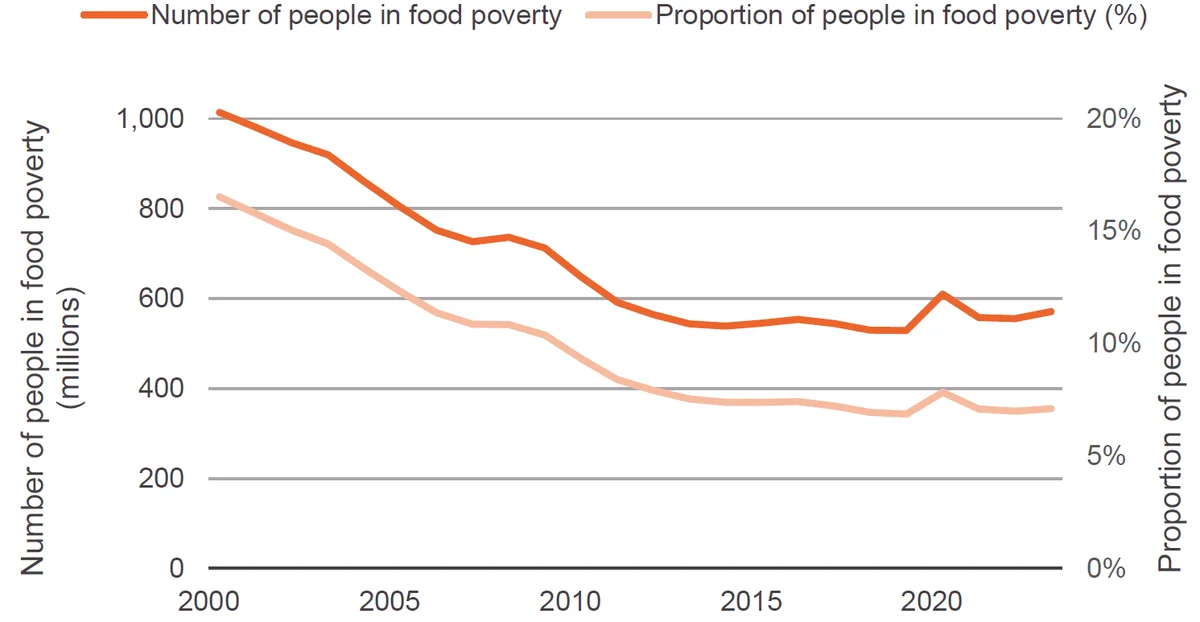
In 2000, one sixth (17%) of the world’s population lived in food poverty, totalling just over 1 billion people. [5] Up until 2019, the global share of people living in food poverty had fallen year-on-year, reaching an estimated 6.9%. Over this 20-year period, the number of people living in food poverty halved to approximately 529 million people.
Figure 2: Number and proportion of people living in food poverty globally, 2000−2023
| Year | Number of people in food poverty | Proportion of people in food poverty (%) |
|---|---|---|
| 2000 | 1,013,945,685 | 16.5% |
| 2001 | 981,000,676 | 15.8% |
| 2002 | 946,228,978 | 15.0% |
| 2003 | 919,744,674 | 14.4% |
| 2004 | 860,158,974 | 13.3% |
| 2005 | 804,387,295 | 12.3% |
| 2006 | 752,456,987 | 11.4% |
| 2007 | 726,722,205 | 10.9% |
| 2008 | 736,151,487 | 10.8% |
| 2009 | 712,696,296 | 10.4% |
| 2010 | 648,956,384 | 9.3% |
| 2011 | 591,519,364 | 8.4% |
| 2012 | 564,093,071 | 7.9% |
| 2013 | 543,847,867 | 7.5% |
| 2014 | 539,002,728 | 7.4% |
| 2015 | 545,633,975 | 7.4% |
| 2016 | 553,377,745 | 7.4% |
| 2017 | 544,442,475 | 7.2% |
| 2018 | 529,761,041 | 6.9% |
| 2019 | 528,997,922 | 6.9% |
| 2020 | 610,204,805 | 7.8% |
| 2021 | 557,941,667 | 7.1% |
| 2022 | 555,646,956 | 7.0% |
| 2023 | 570,689,162 | 7.1% |
Source: Development Initiatives based on national sources, World Bank, Food and Agriculture Organization and World Bank Poverty and Inequality Platform.
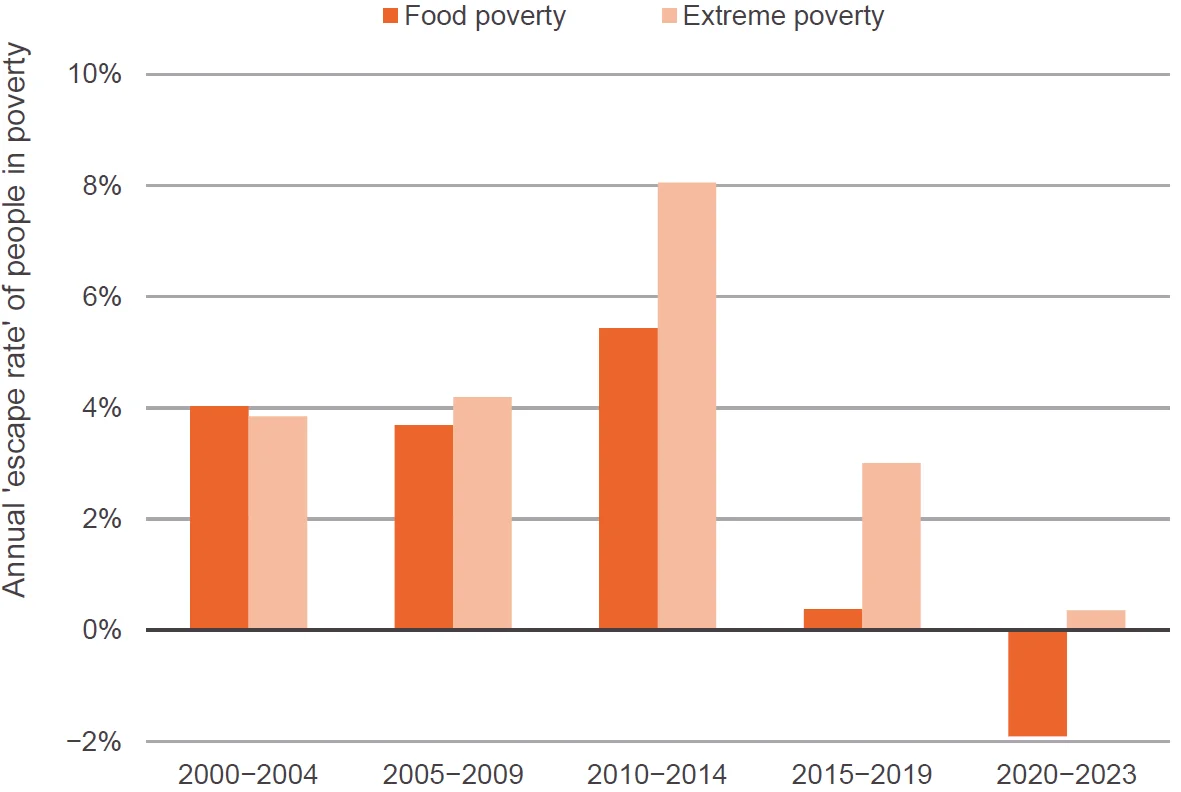
Since 2005, the escape rate of food poverty has been substantially slower than that of extreme poverty
The five-year ‘escape rate’ − or average annual rate of reduction − of food poverty remained positive between 2000 and 2019, albeit decreasing significantly between 2015 and 2019. Meanwhile, the escape rate of extreme poverty has not only risen since 2005, but on average between 2010 and 2019 it doubled the rate of reduction of food poverty. Following the Covid-19 pandemic and the war in Ukraine, the escape rate for food poverty reversed and became negative between 2020−2023, whereas the rate for extreme poverty remained positive.
Figure 3: Escape rates of food poverty compared to extreme poverty, 2000−2023
Regional trends in food poverty
While at a global level food poverty has declined since 2000, this trend has not been consistent across every geographical region. The geographical distribution of food poverty has changed substantially over the past two decades, with rapid progress in reducing food poverty made in some regions, and a reversal in progress in others.
People living in food poverty are increasingly concentrated in Africa and the Middle East…
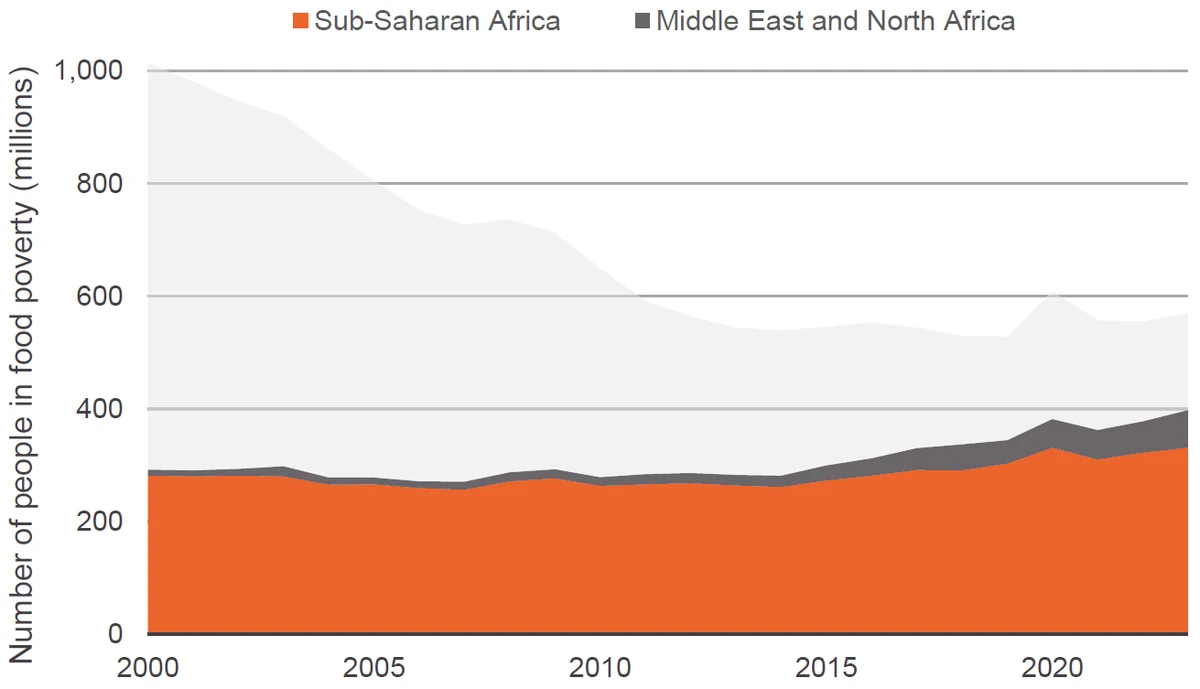
Since 2000, in contrast to other regions, the Middle East and North Africa and sub-Saharan Africa have seen increasing numbers of people living in food poverty. In 2000, 292 million people in Africa and the Middle East were living in food poverty, representing just under a third (29%) of the global total. In 2023, this number has increased substantially to 397 million people, representing 70% of the global population in food poverty. The majority of these people − 331 million − are located in sub-Saharan Africa.
Figure 4: Number of people living in food poverty in Africa and the Middle East
| 2000 | 2001 | 2002 | 2003 | 2004 | 2005 | 2006 | 2007 | 2008 | 2009 | 2010 | 2011 | 2012 | 2013 | 2014 | 2015 | 2016 | 2017 | 2018 | 2019 | 2020 | 2021 | 2022 | 2023 | |
|---|---|---|---|---|---|---|---|---|---|---|---|---|---|---|---|---|---|---|---|---|---|---|---|---|
| Sub-Saharan Africa | 281,248,775 | 279,736,245 | 281,431,353 | 280,137,318 | 265,443,082 | 266,070,684 | 259,090,457 | 256,354,043 | 271,364,101 | 276,660,700 | 263,398,668 | 266,091,872 | 267,958,874 | 264,009,958 | 261,001,507 | 272,827,230 | 281,159,278 | 291,577,078 | 290,772,240 | 302,633,088 | 330,717,492 | 310,429,349 | 322,295,447 | 331,060,823 |
| Middle East and North Africa | 10,796,470 | 11,135,684 | 11,872,230 | 18,275,765 | 12,898,126 | 11,808,888 | 12,377,479 | 14,252,463 | 16,183,998 | 15,797,884 | 15,477,706 | 17,736,232 | 18,040,104 | 18,595,529 | 20,116,289 | 26,957,815 | 31,264,683 | 38,566,149 | 46,022,824 | 42,031,071 | 51,378,608 | 51,879,508 | 55,461,869 | 66,628,369 |
| Other regions | 721,909,829 | 690,131,575 | 652,926,852 | 621,333,595 | 581,820,611 | 526,510,927 | 480,992,913 | 456,118,264 | 448,606,877 | 420,238,613 | 370,082,802 | 307,692,542 | 278,094,093 | 261,239,989 | 257,888,460 | 245,851,480 | 240,958,298 | 214,098,864 | 192,258,326 | 183,398,079 | 227,060,822 | 194,516,699 | 176,687,825 | 171,763,876 |
Source: Development Initiatives based on national sources, World Bank, Food and Agriculture Organization and World Bank Poverty and Inequality Platform.
…whereas rates of food poverty have dropped significantly in South and East Asia since 2000
The regions of East Asia and Pacific and South Asia represented close to half (48%) of people living in food poverty in 2000, totalling 485 million people. By 2010, this figure had nearly halved to 249 million people, and by 2023 it had fallen to just 55 million people living in food poverty. These two regions now represent 10% of the global population in food poverty.
Figure 5: Number of people living in food poverty in South and East Asia
| 2000 | 2001 | 2002 | 2003 | 2004 | 2005 | 2006 | 2007 | 2008 | 2009 | 2010 | 2011 | 2012 | 2013 | 2014 | 2015 | 2016 | 2017 | 2018 | 2019 | 2020 | 2021 | 2022 | 2023 | |
|---|---|---|---|---|---|---|---|---|---|---|---|---|---|---|---|---|---|---|---|---|---|---|---|---|
| South Asia | 296,782,645 | 292,292,685 | 291,816,364 | 283,316,954 | 272,879,365 | 253,864,153 | 239,802,985 | 222,634,076 | 210,046,103 | 199,334,522 | 171,696,909 | 122,665,829 | 104,789,677 | 107,178,839 | 106,299,696 | 98,519,945 | 95,366,620 | 75,499,216 | 61,666,282 | 54,297,666 | 70,940,783 | 46,312,940 | 36,091,045 | 30,693,648 |
| East Asia and Pacific | 188,710,509 | 171,267,358 | 145,773,891 | 123,752,363 | 117,914,665 | 94,588,252 | 93,142,170 | 94,476,944 | 104,196,663 | 90,479,091 | 77,018,472 | 69,543,723 | 62,407,183 | 49,597,501 | 45,342,439 | 39,156,217 | 36,206,555 | 30,129,781 | 26,860,016 | 20,950,569 | 28,702,955 | 30,242,264 | 25,161,709 | 24,027,835 |
| Other regions | 528,461,920 | 517,443,460 | 508,640,181 | 512,677,361 | 469,367,788 | 455,938,095 | 419,515,693 | 409,613,749 | 421,912,211 | 422,883,585 | 400,243,796 | 399,311,093 | 396,896,211 | 387,069,135 | 387,364,120 | 407,960,363 | 421,809,083 | 438,613,094 | 440,527,092 | 452,814,003 | 509,513,183 | 480,270,351 | 493,192,386 | 514,731,586 |
Source: Development Initiatives based on national sources, World Bank, Food and Agriculture Organization and World Bank Poverty and Inequality Platform.
National trends in food poverty
Since 2010, food poverty has become increasingly concentrated in the regions of sub-Saharan Africa and the Middle East and North Africa. However, these regional trends hide differences in national burdens of food poverty both within and outside of these regions. Tracking country-level progress is critical in understanding where efforts must be focused to end food poverty.
In 11 countries, more than half of the population are living in food poverty in 2023
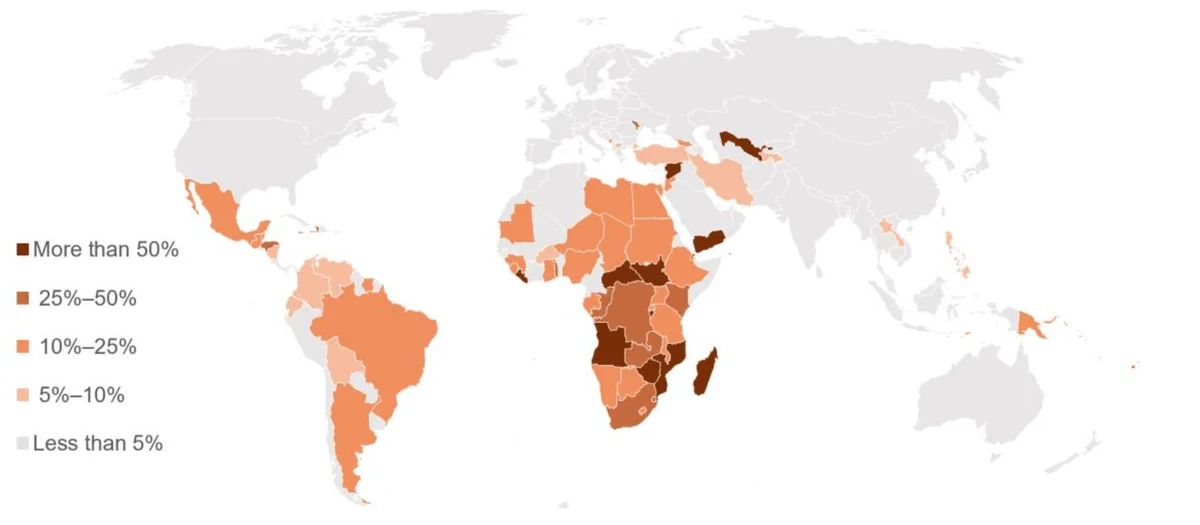
Among countries with available data, Syria (75%), Central African Republic (74%), Yemen (72%), Burundi (71%), and South Sudan (70%) are found to have the highest rates of food poverty in 2023. These countries form part of a group of 11 countries which currently have more than half of their populations living in food poverty, with all except one (Uzbekistan) located in the Middle East or Africa. Together, these 11 countries represent 164 million people in food poverty − or just under a third (29%) of the global total.
Figure 6: Global overview of national food poverty rates in 2023
| ISO | Food poverty rate | Group |
|---|---|---|
| SYR | 75% | 0.5 |
| CAF | 74% | 0.5 |
| YEM | 72% | 0.5 |
| BDI | 71% | 0.5 |
| SSD | 70% | 0.5 |
| MOZ | 69% | 0.5 |
| ZWE | 69% | 0.5 |
| LBR | 66% | 0.5 |
| MDG | 65% | 0.5 |
| AGO | 59% | 0.5 |
| UZB | 57% | 0.5 |
| COD | 45% | 0.25 |
| ZMB | 44% | 0.25 |
| MDA | 43% | 0.25 |
| COG | 42% | 0.25 |
| FJI | 38% | 0.25 |
| SWZ | 38% | 0.25 |
| KEN | 36% | 0.25 |
| HND | 33% | 0.25 |
| TGO | 32% | 0.25 |
| ZAF | 31% | 0.25 |
| DJI | 27% | 0.25 |
| HTI | 26% | 0.25 |
| COM | 25% | 0.25 |
| SUR | 24% | 0.1 |
| TLS | 24% | 0.1 |
| GTM | 24% | 0.1 |
| UGA | 23% | 0.1 |
| PNG | 22% | 0.1 |
| MWI | 22% | 0.1 |
| GIN | 22% | 0.1 |
| JAM | 21% | 0.1 |
| TZA | 21% | 0.1 |
| ETH | 20% | 0.1 |
| TCD | 19% | 0.1 |
| GMB | 17% | 0.1 |
| NER | 17% | 0.1 |
| LBY | 16% | 0.1 |
| SDN | 15% | 0.1 |
| BWA | 15% | 0.1 |
| MRT | 15% | 0.1 |
| SLE | 14% | 0.1 |
| JOR | 14% | 0.1 |
| MNE | 13% | 0.1 |
| MEX | 13% | 0.1 |
| NGA | 12% | 0.1 |
| EGY | 12% | 0.1 |
| GAB | 12% | 0.1 |
| BLZ | 12% | 0.1 |
| BRA | 12% | 0.1 |
| VUT | 11% | 0.1 |
| GEO | 11% | 0.1 |
| STP | 11% | 0.1 |
| ARG | 11% | 0.1 |
| SLB | 11% | 0.1 |
| RWA | 11% | 0.1 |
| NAM | 10% | 0.1 |
| GHA | 10% | 0.1 |
| LSO | 10% | 0.1 |
| VEN | 10% | 0.05 |
| COL | 10% | 0.05 |
| BOL | 9% | 0.05 |
| FSM | 8% | 0.05 |
| PER | 8% | 0.05 |
| LCA | 8% | 0.05 |
| LAO | 8% | 0.05 |
| PHL | 8% | 0.05 |
| ECU | 7% | 0.05 |
| IRN | 7% | 0.05 |
| KIR | 7% | 0.05 |
| BFA | 6% | 0.05 |
| MKD | 6% | 0.05 |
| TJK | 6% | 0.05 |
| NIC | 5% | 0.05 |
| TUR | 5% | 0.05 |
Source: Development Initiatives based on national sources, World Bank, Food and Agriculture Organization and World Bank Poverty and Inequality Platform.
Notes: Map powered by Bing.
Since 2010, rates of food poverty have increased for 43 countries, and have at least doubled in 13
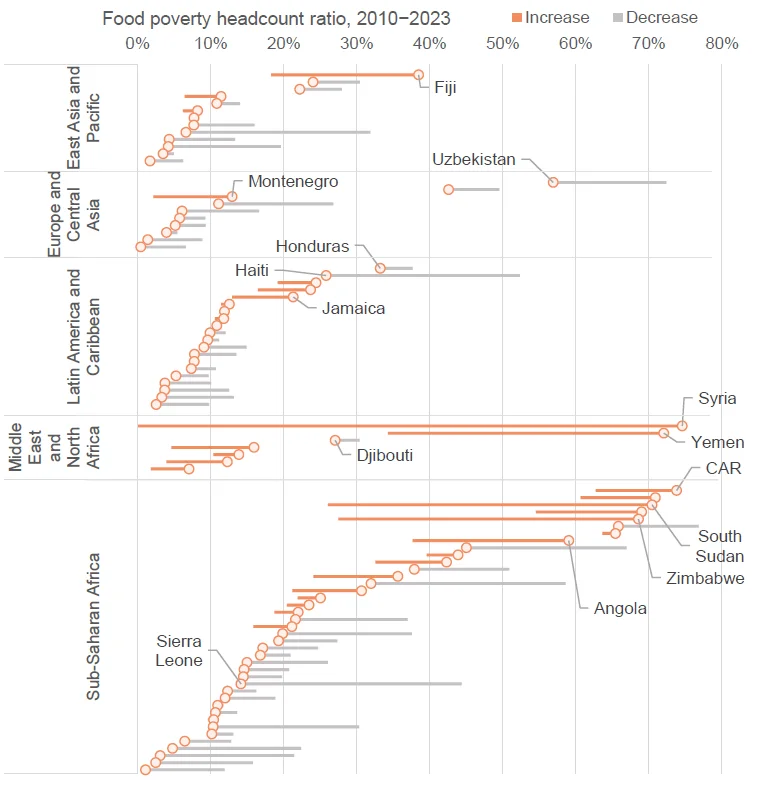
Despite an overall reduction in global food poverty since 2010, rates of food poverty have increased in 43 countries. For countries with available data, all but one country (Djibouti) in the Middle East and North Africa region have seen an increase in rates of food poverty since 2010. Among countries in sub-Saharan Africa, two-fifths have higher rates of food poverty in 2023 than 2010. Thirteen countries have had rates more than double in the past 13 years − notable among these are Iran (from 1.8% to 7.1%), Libya (4.6% to 16%), and Zimbabwe (27% to 69%).
Figure 7: Change in the rate of food poverty at the national level, 2010−2023
| Food poverty rate | |||
|---|---|---|---|
| Country | Region | 2010 | |
| East Asia and Pacific | |||
| Fiji | 18.3% | 38.5% | |
| Timor-Leste | 30.4% | 24.0% | |
| Papua New Guinea | 28.0% | 22.2% | |
| Vanuatu | 6.5% | 11.5% | |
| Solomon Islands | 14.0% | 10.9% | |
| Micronesia | 6.2% | 8.2% | |
| Lao PDR | 7.6% | 7.7% | |
| Philippines | 16.0% | 7.7% | |
| Kiribati | 31.9% | 6.6% | |
| Indonesia - Rural | 13.4% | 4.4% | |
| Myanmar | 19.6% | 4.2% | |
| Mongolia | 5.0% | 3.5% | |
| Thailand | 6.2% | 1.7% | |
| Europe and Central Asia | |||
| Uzbekistan | 72.4% | 56.9% | |
| Moldova | 49.5% | 42.6% | |
| Montenegro | 2.2% | 13.0% | |
| Georgia | 26.8% | 11.1% | |
| North Macedonia | 16.6% | 6.1% | |
| Tajikistan | 9.3% | 5.8% | |
| Turkiye | 9.3% | 5.2% | |
| Serbia | 5.5% | 4.0% | |
| Kyrgyz Republic | 8.9% | 1.4% | |
| Belarus | 6.6% | 0.5% | |
| Latin America and Caribbean | |||
| Honduras | 37.7% | 33.2% | |
| Haiti | 52.4% | 25.8% | |
| Suriname | 19.2% | 24.4% | |
| Guatemala | 16.5% | 23.7% | |
| Jamaica | 12.9% | 21.3% | |
| Mexico | 11.4% | 12.6% | |
| Belize | 11.9% | 11.9% | |
| Brazil | 10.6% | 11.8% | |
| Argentina | 10.5% | 10.9% | |
| Venezuela | 12.1% | 9.9% | |
| Colombia | 11.2% | 9.6% | |
| Bolivia | 14.9% | 9.1% | |
| Peru | 13.6% | 7.8% | |
| St. Lucia | 7.6% | 7.8% | |
| Ecuador | 10.7% | 7.4% | |
| Nicaragua | 9.7% | 5.3% | |
| Paraguay | 10.1% | 3.8% | |
| El Salvador | 12.6% | 3.7% | |
| Guyana | 13.2% | 3.3% | |
| Dominica | 9.8% | 2.5% | |
| Middle East and North Africa | |||
| Syria | 0.0% | 74.6% | |
| Yemen | 34.3% | 72.0% | |
| Djibouti | 30.4% | 27.1% | |
| Libya | 4.6% | 15.9% | |
| Jordan | 10.4% | 13.9% | |
| Egypt | 3.9% | 12.3% | |
| Iran | 1.8% | 7.1% | |
| Sub-Saharan Africa | |||
| CAR | 62.7% | 73.8% | |
| Burundi | 60.6% | 70.9% | |
| South Sudan | 26.0% | 70.4% | |
| Mozambique | 54.5% | 69.0% | |
| Zimbabwe | 27.5% | 68.6% | |
| Liberia | 76.8% | 65.8% | |
| Madagascar | 63.6% | 65.5% | |
| Angola | 37.7% | 59.0% | |
| DRC | 67.0% | 45.0% | |
| Zambia | 39.6% | 43.9% | |
| Congo, Rep. | 32.6% | 42.3% | |
| Eswatini | 50.9% | 37.9% | |
| Kenya | 24.1% | 35.7% | |
| Togo | 58.6% | 32.0% | |
| South Africa | 21.2% | 30.7% | |
| Comoros | 21.9% | 25.1% | |
| Uganda | 20.4% | 23.5% | |
| Malawi | 18.7% | 22.0% | |
| Guinea | 37.0% | 21.6% | |
| Tanzania | 15.9% | 21.1% | |
| Ethiopia | 37.6% | 19.9% | |
| Chad | 27.3% | 19.3% | |
| The Gambia | 24.7% | 17.2% | |
| Niger | 20.9% | 16.8% | |
| Sudan | 26.0% | 15.0% | |
| Botswana | 20.7% | 14.6% | |
| Mauritania | 19.8% | 14.5% | |
| Sierra Leone | 44.4% | 14.2% | |
| Nigeria | 16.2% | 12.3% | |
| Gabon | 18.9% | 12.0% | |
| Sao Tome & Principe | 11.7% | 11.0% | |
| Rwanda | 13.6% | 10.7% | |
| Namibia | 9.6% | 10.4% | |
| Ghana | 30.3% | 10.4% | |
| Lesotho | 13.1% | 10.2% | |
| Burkina Faso | 12.8% | 6.5% | |
| Mali | 22.4% | 4.8% | |
| Senegal | 21.4% | 3.1% | |
| Cote d'Ivoire | 15.8% | 2.5% | |
| Benin | 11.9% | 1.1% | |
Source: Development Initiatives based on national sources, World Bank, Food and Agriculture Organization and World Bank Poverty and Inequality Platform.
Notes: Data presented is for 90 economies with food poverty headcount ratios greater than 5% in 2010 or 2023. CAR = Central African Republic.
This factsheet is an update of DI’s 2020 Food poverty: global, regional and national factsheet .
Downloads
Notes
-
1
Much of the missing global population are situated in high-income countries, which rarely publish absolute food poverty lines, and are assumed here to have zero food poverty. Other missing countries have food poverty rates estimated by regional average. Notably these include Afghanistan, Pakistan, Somalia, and Venezuela.Return to source text
-
2
Food and Agriculture Organization of the United Nations, 2005. Impacts of Policies on Poverty: Absolute Poverty Lines. Available at: https://www.fao.org/policy-support/tools-and-publications/resources-details/en/c/446032/Return to source text
-
3
Household-produced food, including subsistence farming, is generally counted in household income/expenditure data.Return to source text
-
4
Average household income/expenditure are weighted to adult-equivalence (21 years): children are generally weighted according to their age and sex, depending on the national context.Return to source text
-
5
Based on economies with available data.Return to source text
Related content
An uncertain road: Examining the World Bank’s climate change poverty projections
DI explores World Bank climate change poverty forecasts, discusses the uncertainty around climate change’s potential impact on extreme poverty and highlights the need for timely, high-quality data.
LNOB assessment in Nepal: Data landscaping in Simta municipality
This report, co-produced with BASE, draws on DI's data landscaping work in Simta, Nepal. It explains how to improve the data ecosystem to leave no one behind.
LNOB assessment in Nepal: Data landscaping in Tulsipur municipality
This report, co-produced with BASE, draws on DI's data landscaping work in Tulsipur, Nepal. It explains how to improve the data ecosystem to leave no one behind.
