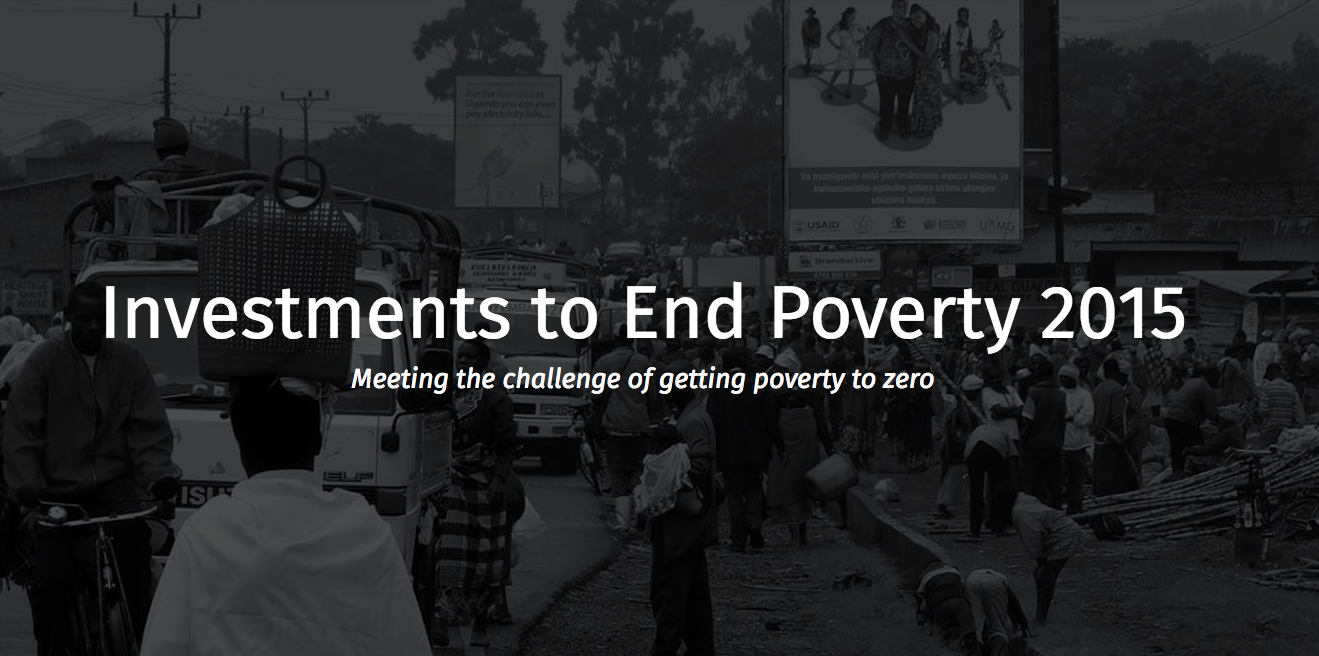
Explore the report highlights by clicking the image
Ending extreme poverty over the next 15 years will be much more difficult than halving it has been. Our second Investments to End Poverty report and our online Development Data Hub show that when data is disaggregated, people are being left behind. Where poverty appears to be reducing in some countries, many people are being lost along the way. Many of the world’s poorest countries need a significant change in trajectory if they are to see an end to poverty.
Investments to End Poverty 2015 looks at the challenge of getting poverty to zero, the mix of resources available for tackling poverty, and how the data needs to improve to be fit for the purpose of ending extreme poverty by 2030.
The report focuses on analysing and quantifying the extent of the challenge to make sure no one is left behind, and it looks at the role of domestic and international resources including the comparative advantage of official development assistance (ODA). The report investigates the quality of the data, bringing in new research on civil registration data in Africa and the potential of initiatives such as the International Aid Transparency Initiative. The report shows that we need to be ambitious and committed to improving data to ensure we are equipped for getting poverty to zero.
Key findings:
Ending poverty will be more challenging than halving it has been – people are still being left behind.
- In 30 countries, the number of people living in extreme poverty increased between 2002 and 2011
- The 18 countries showing the most rapid increase in poverty in the last decade are all in sub-Saharan Africa
- To end poverty by 2030, sub-Saharan Africa would need to reduce poverty at a pace faster than South Asia has achieved over the last 15 years
- The proportion of people living in extreme poverty in fragile states has risen from around 20% in 1990 to 62% in 2015
- National trends in poverty reduction mask big differences within countries. Between 2005 and 2012 India saw 10 states reduce poverty by 10% a year while in 8 smaller states poverty actually rose.
The resources that could drive poverty eradication should be targeted at the poorest people, wherever they are.
- Governments in many developing countries raise too little revenue to implement the SDGs at the national level
- In 24 of the 33 countries where depth of poverty is highest globally, government revenues are less than PPP$1.37 per person per day compared with PPP$34 per person per day in high income countries. (PPP = adjusted for purchasing power parity)
- Low government revenues mean that, although sub-Saharan Africa spends the second highest proportion of revenues on health among all regions, spending per person is the second lowest of any region
- Where poverty is deepest, revenue is projected to have the slowest growth
- The comparative advantage of aid is that it can be targeted more directly at reducing poverty than other resources
- There is significant room to improve the targeting of aid. 29% of ODA goes to countries with a depth of poverty of less than 1%, and in 2013 only 9% of ODA commitments to build resilience against environmental shocks went to the most environmentally vulnerable countries.
We need much better data on poverty and resources because the data is not fit for purpose to get poverty to zero.
- Our understanding of global poverty is not based on direct knowledge of people in poverty but is from surveys layered with assumptions to derive estimates about level, depth and distribution of poverty
- Systems to produce even basic information on how many people there are do not function in many African countries
- Just 12 of 55 African countries have comprehensive birth registration and a quarter of African countries have not done a survey since 2008 or earlier.
Downloads
Full report – PDF
Chapter 1: Ending extreme poverty by 2030 – PDF Data
Chapter 2: The mix of all resources – PDF Data
Chapter 3: Domestic public resources – PDF Data
Chapter 4: International official finance – PDF Data
Chapter 5: Data for decision making – PDF Data
Notes – PDF
Annex – PDF
Download key graphics from the report
